Economic inequality in India: a comparative analysis
Page 1 of 2 • 1, 2 ![]()

Economic inequality in India: a comparative analysis
![]() by Idéfix Fri Aug 02, 2013 1:44 am
by Idéfix Fri Aug 02, 2013 1:44 am
1. Is inequality getting worse despite (or because of) economic growth?
2. Are the poorest segments seeing their real incomes rise as a result of this economic growth?
3. How do the current UPA government and the previous NDA government compare in terms of addressing this inequality?
4. Are the UPA's visibly larger subsidies and social welfare schemes correlated with reductions in inequality?
The key data for my analysis are from the National Statistical Surveys on household expenditure. These surveys are conducted once in about five years. There is a proposal to make them more frequent; the latest one has been done two years after the last one. These surveys do NOT measure income. They measure consumer expenditure patterns in good detail. It is these surveys that form the basis for defining the market baskets for the several consumer price indices. These reports provide a comparison of how much people at are spending per month. The survey reports show the Monthly per-capita Consumer Expenditure (MPCE), and provide a detailed breakdown of average MPCE for various into MPCE fractile classes. To put that in English, the reports tell you the average amount that the poorest people are spending each month, in comparison to what the middle-of-the-pack and the richest people.
Below are three charts, one each for the bottom, middle, and top quintile by MPCE. First, let us look at the chart for the bottom quintile (or, in English, the average monthly spend of the poorest 240 million of India's 1.2 billion people):
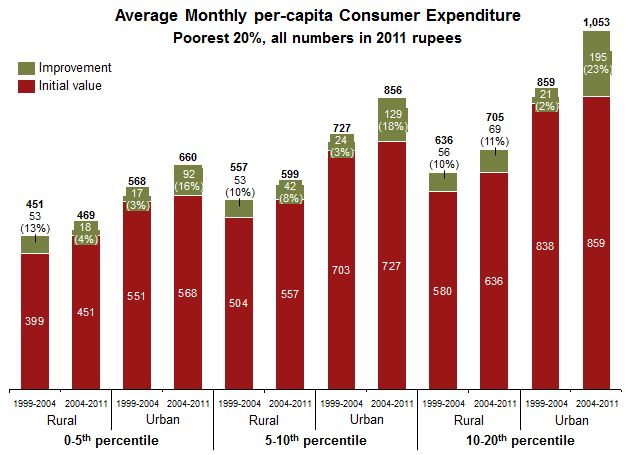
The surveys break down the bottom 20% into three subgroups, and each subgroup has numbers for rural and urban consumers. This is how you read the chart: the 0-5th percentile group in rural areas spent on average just Rs. 469 a month in 2011. That is on everything: food, clothes, shelter, utilities, entertainment, taxes, and anything else. At that bottom rung on the economic ladder, people live -- if you can call it that -- on Rs. 15, or less than $0.25, a day. The internationally accepted norm for abject poverty is $1.25 a day. In 1999, the bottom 5% of India's rural people used to spend an average of Rs. 399 a month (in 2011 rupees; that is after adjusting for inflation). By 2004, their monthly expenditure had gone up to Rs. 451, for an improvement of 13%. Between 2004 and 2011, their monthly expenditure improved by another 4%.
My three take-aways from this chart for the poorest people:
1. Expenditures (and by proxy, incomes) have grown in the 10-20% range for most subgroups within this group.
2. Expenditures (and by proxy, incomes) have grown the least for the poorest of the poor, i.e. the 0-5th percentile group.
3. Improvements were greater under NDA for the two poorest rural subgroups, while they were greater under UPA for the other four subgroups.
... to be continued ...
Sources: Ministry of Statistics and Programme Implementation, Key Indicators of Household Consumer Expenditure in India, 2011-12, tables T3 and T5 on pages 11 and 12; and Level and Pattern of Consumer Expenditure, 2004-05, Table P7 on page 19. Both documents may be downloaded after signing up on their website.

Idéfix- Posts : 8808
Join date : 2012-04-26
Location : Berkeley, CA
Re: Economic inequality in India: a comparative analysis
![]() by Idéfix Fri Aug 02, 2013 1:53 am
by Idéfix Fri Aug 02, 2013 1:53 am
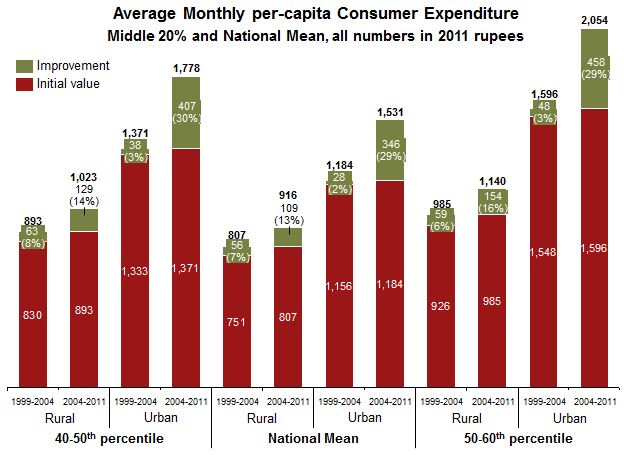
This chart shows overall improvements in the 20-40% range. Every single subgroup shown here had a cumulative improvement since 1999 that is over 20%. Now take a quick look back at the chart for the poorest people. My key take-aways at this point are:
1. Growth rates for the middle-expenditure folks are significantly higher than for the poorest. The gap between the poorest and the middle is growing.
2. In this expenditure range, all subgroups improved their positions more under UPA than under NDA.
3. The national mean expenditure is Rs. 916 in rural areas, and Rs. 1,531 in urban areas. That is still below the $1.25 a day mark for both groups. India is, on average, still a rather poor country.
... to be continued ...
Idéfix- Posts : 8808
Join date : 2012-04-26
Location : Berkeley, CA
Re: Economic inequality in India: a comparative analysis
![]() by Idéfix Fri Aug 02, 2013 2:02 am
by Idéfix Fri Aug 02, 2013 2:02 am
Here is the chart for that group:
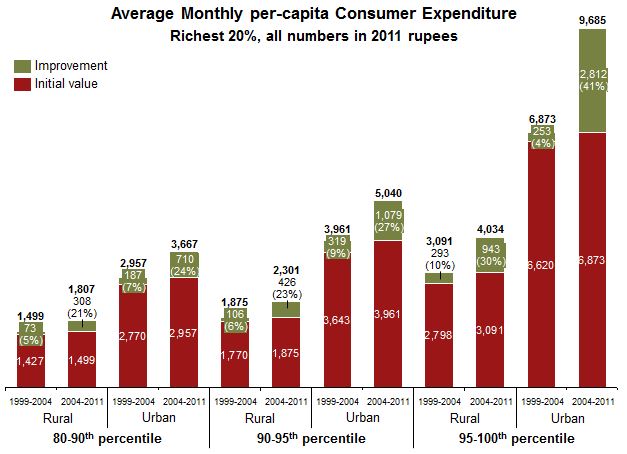
My takeaways from this are:
1. This is where you see some impressive growth. The richest are spending a lot more than they used to, presumably because they are making a lot more than they used to.
2. The gap between the top 20% and the middle 20% is growing, perhaps faster than the gap between the middle 20% and the bottom 20%.
3. Across all subgroups at this expenditure level, increases were more under UPA than NDA.
In the next post, I will try to answer my original questions based on all these data.
Idéfix- Posts : 8808
Join date : 2012-04-26
Location : Berkeley, CA
Re: Economic inequality in India: a comparative analysis
![]() by Kayalvizhi Fri Aug 02, 2013 2:05 am
by Kayalvizhi Fri Aug 02, 2013 2:05 am
Kayalvizhi- Posts : 3659
Join date : 2011-05-16
Re: Economic inequality in India: a comparative analysis
![]() by Idéfix Fri Aug 02, 2013 2:11 am
by Idéfix Fri Aug 02, 2013 2:11 am
1. Is inequality getting worse despite (or because of) economic growth?
Yes. The data clearly show a widening gap between the bottom 20% and the middle 20%. The gap between the middle 20% and the top 20% may be widening even more rapidly. Economic inequality is growing in India.
2. Are the poorest segments seeing their real incomes rise as a result of this economic growth?
Yes, the poorest segments are seeing their real incomes rise. Even the poorest of the rural poor saw a cumulative 18% increase in their real expenditure in that 12 year period. That is an annual rate just over 1%, which is much, much slower than the rate of real GDP growth.
3. How do the current UPA government and the previous NDA government compare in terms of addressing this inequality?
Of the 18 subgroups analyzed, 16 showed better improvements under UPA than NDA. However, the 2 subgroups that improved better under NDA are the two poorest. Economic inequality is growing at a more rapid rate under UPA than it did under NDA.
4. Are the UPA's visibly larger subsidies and social welfare schemes correlated with reductions in inequality?
As far as I can infer from the data, no. While real GDP grew at a CAGR of 8.2% under UPA, expenditures (and by proxy, incomes) of the poorest subgroup grew at a CAGR less than 0.5%. So the supposedly pro-poor policies of the UPA do not seem to have the desired results.
Idéfix- Posts : 8808
Join date : 2012-04-26
Location : Berkeley, CA
Re: Economic inequality in India: a comparative analysis
![]() by Idéfix Fri Aug 02, 2013 2:14 am
by Idéfix Fri Aug 02, 2013 2:14 am
Haven't really looked for it. May be I will when I have some extra time.Kayalvizhi wrote:What about the data I asked you?
Idéfix- Posts : 8808
Join date : 2012-04-26
Location : Berkeley, CA
Re: Economic inequality in India: a comparative analysis
![]() by goodcitizn Fri Aug 02, 2013 2:26 am
by goodcitizn Fri Aug 02, 2013 2:26 am
goodcitizn- Posts : 3263
Join date : 2011-05-03
Re: Economic inequality in India: a comparative analysis
![]() by Idéfix Fri Aug 02, 2013 2:30 am
by Idéfix Fri Aug 02, 2013 2:30 am
Interesting, I missed that while staring at the charts. Let me go to my spreadsheet and see if what you are saying is consistently true in the data. If it is, that could potentially be the impact of NREGA which provides money to poor rural people.goodcitizn wrote:Interesting. I will have to study this closer. One thing that stands out consistently is that the difference between the rural and urban expenditure in each of the three percentile groups is far higher under NDA than UPA i.e. the gap was bridged closer under UPA. If the rural expenditure grew more than urban expenditure under UPA, is it because of improved rural employment and productivity or because of more companies moving into rural areas to reduce costs or a combination?
Idéfix- Posts : 8808
Join date : 2012-04-26
Location : Berkeley, CA
Re: Economic inequality in India: a comparative analysis
![]() by goodcitizn Fri Aug 02, 2013 2:37 am
by goodcitizn Fri Aug 02, 2013 2:37 am
This was on your first chart ...up to 20 percentile. The gap is much more consistent between 1999 and 2004. I just took a cursory look. I haven't looked closely at the other in my hasty comment.Idéfix wrote:Interesting, I missed that while staring at the charts. Let me go to my spreadsheet and see if what you are saying is consistently true in the data. If it is, that could potentially be the impact of NREGA which provides money to poor rural people.goodcitizn wrote:Interesting. I will have to study this closer. One thing that stands out consistently is that the difference between the rural and urban expenditure in each of the three percentile groups is far higher under NDA than UPA i.e. the gap was bridged closer under UPA. If the rural expenditure grew more than urban expenditure under UPA, is it because of improved rural employment and productivity or because of more companies moving into rural areas to reduce costs or a combination?
goodcitizn- Posts : 3263
Join date : 2011-05-03
Re: Economic inequality in India: a comparative analysis
![]() by Merlot Daruwala Fri Aug 02, 2013 2:39 am
by Merlot Daruwala Fri Aug 02, 2013 2:39 am
Private sector is only going to Tier 2 and Tier 3 cities to reduce costs - these are still very much urban centers.

Merlot Daruwala- Posts : 5005
Join date : 2011-04-29
Re: Economic inequality in India: a comparative analysis
![]() by Idéfix Fri Aug 02, 2013 2:43 am
by Idéfix Fri Aug 02, 2013 2:43 am
Idéfix- Posts : 8808
Join date : 2012-04-26
Location : Berkeley, CA
Re: Economic inequality in India: a comparative analysis
![]() by rawemotions Fri Aug 02, 2013 3:13 am
by rawemotions Fri Aug 02, 2013 3:13 am
Idéfix wrote:Interesting, I missed that while staring at the charts. Let me go to my spreadsheet and see if what you are saying is consistently true in the data. If it is, that could potentially be the impact of NREGA which provides money to poor rural people.goodcitizn wrote:Interesting. I will have to study this closer. One thing that stands out consistently is that the difference between the rural and urban expenditure in each of the three percentile groups is far higher under NDA than UPA i.e. the gap was bridged closer under UPA. If the rural expenditure grew more than urban expenditure under UPA, is it because of improved rural employment and productivity or because of more companies moving into rural areas to reduce costs or a combination?
NREGA was a good policy to provide employment to the most ,needy, but by guaranteeing it to everybody, they implemented without forethought. It increased the lower wage limit. Moreover with guaranteed NREGA, the common refrain in Villages in India is that, they are not getting labour for Crop Harvesting, seed laying and similar seasonal activities.
As a positive, It is also causing a shift to mechanized farming in the long run, which is good.
However in the intervening period the land owners were not prepared for this kind of minimum wages, and that fueled inflation. When the land owners were forced to up the pay, that effect was passed on to retail crop prices also including fruits, vegetables and Poultry. Once food prices increased, it increased processed food prices and prices of food in restaurants, and since everybody depends on food, it has resulted in an increase in prices for all kind of low end services.
rawemotions- Posts : 1690
Join date : 2011-05-03
Re: Economic inequality in India: a comparative analysis
![]() by Idéfix Fri Aug 02, 2013 3:16 am
by Idéfix Fri Aug 02, 2013 3:16 am
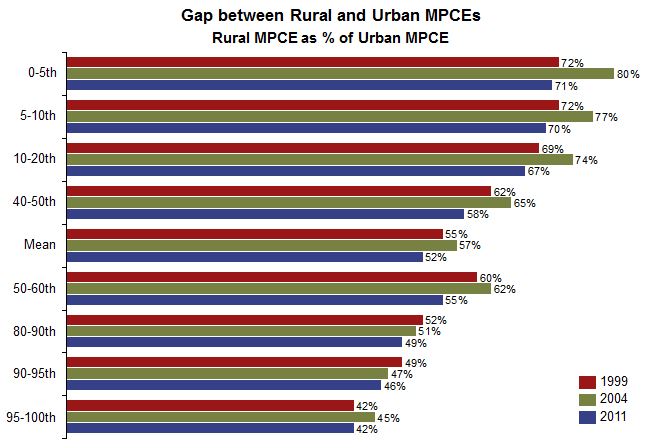
As you can see, the gap consistently worsened under UPA (between 2004 and 2011). And it worsened more for the poorest and middle groups. Under NDA, the gap got better (i.e. reduced) for all poor and middle groups.
I don't know the reasons why. Given NREGA, I would have expected this not to be the case. Perhaps this is another indication that the policies are not bringing about the expected outcomes in terms of higher incomes for the rural poor.
PS: I had earlier posted an incorrect version of this chart with the wrong computation. This is the correct version.
Idéfix- Posts : 8808
Join date : 2012-04-26
Location : Berkeley, CA
Re: Economic inequality in India: a comparative analysis
![]() by rawemotions Fri Aug 02, 2013 3:21 am
by rawemotions Fri Aug 02, 2013 3:21 am
Idéfix wrote:Now to the questions I set out to answer:
1. Is inequality getting worse despite (or because of) economic growth?
Yes. The data clearly show a widening gap between the bottom 20% and the middle 20%. The gap between the middle 20% and the top 20% may be widening even more rapidly. Economic inequality is growing in India.
2. Are the poorest segments seeing their real incomes rise as a result of this economic growth?
Yes, the poorest segments are seeing their real incomes rise. Even the poorest of the rural poor saw a cumulative 18% increase in their real expenditure in that 12 year period. That is an annual rate just over 1%, which is much, much slower than the rate of real GDP growth.
3. How do the current UPA government and the previous NDA government compare in terms of addressing this inequality?
Of the 18 subgroups analyzed, 16 showed better improvements under UPA than NDA. However, the 2 subgroups that improved better under NDA are the two poorest. Economic inequality is growing at a more rapid rate under UPA than it did under NDA.
4. Are the UPA's visibly larger subsidies and social welfare schemes correlated with reductions in inequality?
As far as I can infer from the data, no. While real GDP grew at a CAGR of 8.2% under UPA, expenditures (and by proxy, incomes) of the poorest subgroup grew at a CAGR less than 0.5%. So the supposedly pro-poor policies of the UPA do not seem to have the desired results.
The NDA had effectively 5 years the first year wrecked by politicking, whereas the UPA had the benefit of sustained 9 years. Moreover India was reeling under sanctions in the first two years of NDA regime.
What is real income. Is it income adjusted for Inflation ?
The Truth is that the Poor (more specifically Semi-Urban/urban poor) are feeling that their buying power has reduced, notwithstanding the rise in income. I am not sure whether these charts brings that data out. If not, then there is a difference between perception and data.
rawemotions- Posts : 1690
Join date : 2011-05-03
Re: Economic inequality in India: a comparative analysis
![]() by goodcitizn Fri Aug 02, 2013 3:24 am
by goodcitizn Fri Aug 02, 2013 3:24 am
This is on the segment up to 20%
Last edited by goodcitizn on Fri Aug 02, 2013 3:32 am; edited 1 time in total
goodcitizn- Posts : 3263
Join date : 2011-05-03
Re: Economic inequality in India: a comparative analysis
![]() by Idéfix Fri Aug 02, 2013 3:32 am
by Idéfix Fri Aug 02, 2013 3:32 am
Yes.rawemotions wrote:What is real income. Is it income adjusted for Inflation ?
Idéfix- Posts : 8808
Join date : 2012-04-26
Location : Berkeley, CA
Re: Economic inequality in India: a comparative analysis
![]() by goodcitizn Fri Aug 02, 2013 4:07 am
by goodcitizn Fri Aug 02, 2013 4:07 am
rawemotions wrote:Idéfix wrote:Now to the questions I set out to answer:
1. Is inequality getting worse despite (or because of) economic growth?
Yes. The data clearly show a widening gap between the bottom 20% and the middle 20%. The gap between the middle 20% and the top 20% may be widening even more rapidly. Economic inequality is growing in India.
2. Are the poorest segments seeing their real incomes rise as a result of this economic growth?
Yes, the poorest segments are seeing their real incomes rise. Even the poorest of the rural poor saw a cumulative 18% increase in their real expenditure in that 12 year period. That is an annual rate just over 1%, which is much, much slower than the rate of real GDP growth.
3. How do the current UPA government and the previous NDA government compare in terms of addressing this inequality?
Of the 18 subgroups analyzed, 16 showed better improvements under UPA than NDA. However, the 2 subgroups that improved better under NDA are the two poorest. Economic inequality is growing at a more rapid rate under UPA than it did under NDA.
4. Are the UPA's visibly larger subsidies and social welfare schemes correlated with reductions in inequality?
As far as I can infer from the data, no. While real GDP grew at a CAGR of 8.2% under UPA, expenditures (and by proxy, incomes) of the poorest subgroup grew at a CAGR less than 0.5%. So the supposedly pro-poor policies of the UPA do not seem to have the desired results.
The NDA had effectively 5 years the first year wrecked by politicking, whereas the UPA had the benefit of sustained 9 years. Moreover India was reeling under sanctions in the first two years of NDA regime.
What is real income. Is it income adjusted for Inflation ?
The Truth is that the Poor (more specifically Semi-Urban/urban poor) are feeling that their buying power has reduced, notwithstanding the rise in income. I am not sure whether these charts brings that data out. If not, then there is a difference between perception and data.
I am glad you liked this approach and your comments are right on. I read somewhere that globalization doesn't necessarily translate to reducing inequality for the poor section of the population since they don't derive the same benefits from it. This post motivates me to read up on the rural population, particularly what is being done by the government to grow the agricultural sector.
goodcitizn- Posts : 3263
Join date : 2011-05-03
Re: Economic inequality in India: a comparative analysis
![]() by smArtha Fri Aug 02, 2013 2:31 pm
by smArtha Fri Aug 02, 2013 2:31 pm
From our discussion y'day the real groups of interest from the political angle i.e. 'aam aadmi' experience of economic growth will be the growth rates of income, consumption, asset buys or savings of the bottom 60-80% and that is the lower three or four quintiles. The top 20% can have a totally different picture of growth but that doesn't impact the decisive electorate. On this criteria if the NDA, UPA-1 and UPA-2 are evaluated then we'll be able to explain if the 'perception' is distorted or valid.
Similar analysis, if data is available, will also help to evaluate Modi vs his peers and predecessors. I was not a member on this site during that discussion and will go over those posts later on, if I have time.
smArtha- Posts : 1229
Join date : 2013-07-29
Re: Economic inequality in India: a comparative analysis
![]() by Idéfix Fri Aug 02, 2013 2:45 pm
by Idéfix Fri Aug 02, 2013 2:45 pm
Yeah, it's hard to follow this along without the charts.smArtha wrote:Overall a very good find - the data and analysis of sufficient detail. I still cannot see the charts and so missing the key information.
Having spent some time looking for data, I can say that granular data in a timeseries format (i.e. enabling comparison of progress under different governments) are not available for income or savings. Because of NSS, we have this data for consumption. Consumption mirrors income closely at the bottom of the ladder, but not so much as you move up.smArtha wrote:From our discussion y'day the real groups of interest from the political angle i.e. 'aam aadmi' experience of economic growth will be the growth rates of income, consumption, asset buys or savings of the bottom 60-80% and that is the lower three or four quintiles.
Broadly speaking, UPA-1 shows the greatest improvement, then UPA-2, then NDA. The exceptions are those that I noted on the chart for the poorest quintile: out of the six subgroups there, improvement was better under NDA for two.smArtha wrote:On this criteria if the NDA, UPA-1 and UPA-2 are evaluated then we'll be able to explain if the 'perception' is distorted or valid.
I don't know if NSS publishes data by state for percentile groups. I did want to look for it to complete my analysis of performance when it comes to economic inequality.smArtha wrote:Similar analysis, if data is available, will also help to evaluate Modi vs his peers and predecessors. I was not a member on this site during that discussion and will go over those posts later on, if I have time.[/color]
For the headline number comparison (GDP growth and HDI improvement) for Gujarat, see this thread: https://such.forumotion.com/t14803-gujarat-gdp-growth-and-narendra-modi-s-economic-record
Idéfix- Posts : 8808
Join date : 2012-04-26
Location : Berkeley, CA
Re: Economic inequality in India: a comparative analysis
![]() by Marathadi-Saamiyaar Fri Aug 02, 2013 3:14 pm
by Marathadi-Saamiyaar Fri Aug 02, 2013 3:14 pm
Idéfix wrote:In the recent discussions on the relative economic performance of various state and federal governments in India, one of the topics that was brought up was the degree of economic inequality, and what is happening to that degree of inequality. I wanted to find out how the recent economic growth is being shared. The questions I want to explore are:
Sources: Ministry of Statistics and Programme Implementation, Key Indicators of Household Consumer Expenditure in India, 2011-12, tables T3 and T5 on pages 11 and 12; and Level and Pattern of Consumer Expenditure, 2004-05, Table P7 on page 19. Both documents may be downloaded after signing up on their website.
Please clarify:
1. You are on vacation in Hawaii and totally rained in.
2. You got a new project from Prince Rahul to prepare for their election.
3. You are actually Maulana Rashmunullah (I see a drop in AkbarNama - people are beginning to forget Akbar - I am afraid) and for a change on a mission to Praise UPA..
Marathadi-Saamiyaar- Posts : 17675
Join date : 2011-04-30
Age : 110
Re: Economic inequality in India: a comparative analysis
![]() by Idéfix Fri Aug 02, 2013 3:32 pm
by Idéfix Fri Aug 02, 2013 3:32 pm
Idéfix- Posts : 8808
Join date : 2012-04-26
Location : Berkeley, CA
Re: Economic inequality in India: a comparative analysis
![]() by smArtha Fri Aug 02, 2013 3:36 pm
by smArtha Fri Aug 02, 2013 3:36 pm
rawemotions wrote:
NREGA was a good policy to provide employment to the most ,needy, but by guaranteeing it to everybody, they implemented without forethought. It increased the lower wage limit. Moreover with guaranteed NREGA, the common refrain in Villages in India is that, they are not getting labour for Crop Harvesting, seed laying and similar seasonal activities.
For 2013, the NREGA wages/day in AP is Rs. 149. I know that in 2011 itself unskilled male labor in a remote Adilabad village were asking Rs 300/day for working 9am-6pm schedule. In delta region, it was higher. Granted my data is select samples from two distinct parts of AP. Still, based on these samples, I'm surprised at your observation that people preferred to work for NREGA wages over higher wages that were already prevalent 2 years ago.
smArtha- Posts : 1229
Join date : 2013-07-29
Re: Economic inequality in India: a comparative analysis
![]() by Marathadi-Saamiyaar Fri Aug 02, 2013 3:43 pm
by Marathadi-Saamiyaar Fri Aug 02, 2013 3:43 pm
smArtha wrote:rawemotions wrote:
NREGA was a good policy to provide employment to the most ,needy, but by guaranteeing it to everybody, they implemented without forethought. It increased the lower wage limit. Moreover with guaranteed NREGA, the common refrain in Villages in India is that, they are not getting labour for Crop Harvesting, seed laying and similar seasonal activities.
For 2013, the NREGA wages/day in AP is Rs. 149. I know that in 2011 itself unskilled male labor in a remote Adilabad village were asking Rs 300/day for working 9am-6pm schedule. In delta region, it was higher. Granted my data is select samples from two distinct parts of AP. Still, based on these samples, I'm surprised at your observation that people preferred to work for NREGA wages over higher wages that were already prevalent 2 years ago.
wait a min.. let us go back to hit at Maulana Merlot:
so a NREGA employee will make some Rs 4000 p.m., others make 7500 and in delta region more than that?
So these are all middle class people and living a manageable life that Maulana and Zero were taking about ?
Marathadi-Saamiyaar- Posts : 17675
Join date : 2011-04-30
Age : 110
Re: Economic inequality in India: a comparative analysis
![]() by smArtha Fri Aug 02, 2013 3:49 pm
by smArtha Fri Aug 02, 2013 3:49 pm
smArtha- Posts : 1229
Join date : 2013-07-29
Re: Economic inequality in India: a comparative analysis
![]() by confuzzled dude Fri Aug 02, 2013 3:52 pm
by confuzzled dude Fri Aug 02, 2013 3:52 pm
smArtha wrote:
For 2013, the NREGA wages/day in AP is Rs. 149. I know that in 2011 itself unskilled male labor in a remote Adilabad village were asking Rs 300/day for working 9am-6pm schedule. In delta region, it was higher. Granted my data is select samples from two distinct parts of AP. Still, based on these samples, I'm surprised at your observation that people preferred to work for NREGA wages over higher wages that were already prevalent 2 years ago.
Really! what kind of work they do err services they provide? I thought typical paddy field worker is compensated with Rs.150/day in Kosta area, of course it costs landlord more, as he needs to provide tiFFin, CHai/tea, transportation.
confuzzled dude- Posts : 10205
Join date : 2011-05-08
Re: Economic inequality in India: a comparative analysis
![]() by smArtha Fri Aug 02, 2013 3:58 pm
by smArtha Fri Aug 02, 2013 3:58 pm
Marathadi-Saamiyaar wrote:
wait a min.. let us go back to hit at Maulana Merlot:
so a NREGA employee will make some Rs 4000 p.m., others make 7500 and in delta region more than that?
So these are all middle class people and living a manageable life that Maulana and Zero were taking about ?
Afaik, NREGA only guarantees 100 days of work an year. So we are talking about 15000/yr that averages to 1250/mo.
The 300/day has the caveat that you may or may not get work on a day. However, this 30+ yr aged guy from Adilabad village told me that on an average he has work 20 days/mo at that rate. And he earns Rs. 6k/month, has an ancestral small home, gives 5k to wife to run the family and uses 1k for his own masti. Other hard working ones do come into nearby big towns or even Hyderabad during lean work seasons to find temporary work and take the savings back home.
smArtha- Posts : 1229
Join date : 2013-07-29
Re: Economic inequality in India: a comparative analysis
![]() by Idéfix Fri Aug 02, 2013 4:04 pm
by Idéfix Fri Aug 02, 2013 4:04 pm
That is correct.smArtha wrote:Afaik, NREGA only guarantees 100 days of work an year.
Idéfix- Posts : 8808
Join date : 2012-04-26
Location : Berkeley, CA
Re: Economic inequality in India: a comparative analysis
![]() by smArtha Fri Aug 02, 2013 4:40 pm
by smArtha Fri Aug 02, 2013 4:40 pm
confuzzled dude wrote:Really! what kind of work they do err services they provide? I thought typical paddy field worker is compensated with Rs.150/day in Kosta area, of course it costs landlord more, as he needs to provide tiFFin, CHai/tea, transportation.
Adilabad guy told me that each weekday (except Sunday), he goes to the village center a little before 9am and he takes up any work that any 'mestri' or contractor calls him for. In the non-agricultural season, his work often is loading/unloading lorries that transport anything from grains, vegetables or construction material or moving material/machinery in/out of the factories or mills. Some days he goes to work in other nearby villages in the vehicle arranged by the mEstri but never beyond the main Adilabad town. But the deal is always stuck at his village. He tells me all coolies are particular about chai being served twice - once in the moring and other afternoon. They pack their own lunch from home and eat that during the 1hour lunch slot. Everyone packs up around 6-6:30pm.
Reason I know more details here - he refused my offer of 1lakh loan to buy a used car and run it in Hyderabad. He did some calculations discussing with his friend, an airport cab driver and earning around 15-18k/mo at Hyd, and arrived at the conclusion that he is better off with the 5-6k he is making at his village.
smArtha- Posts : 1229
Join date : 2013-07-29
Re: Economic inequality in India: a comparative analysis
![]() by Idéfix Fri Aug 02, 2013 5:21 pm
by Idéfix Fri Aug 02, 2013 5:21 pm
This is very consistent with the stories I hear from my neck of the woords. For most of them, work = manual labor, without a real specialization in agricultural or other work. They do work that is available: digging ditches for NREGA, loading and unloading lorries, carrying loads for road construction, digging out foundations for new apartment blocks, and agricultural work in the village when that is available (2-3 months in a year, tops). Then there are guys who become part of construction crews, who do develop specialized skills over time. They start carrying loads, and over time become brick-layers, tApI mEstrIs, roof and falsework specialists, etc. I hear that those specialist guys begin to make decent middle-class wages (at least by Indian standards).smArtha wrote:confuzzled dude wrote:Really! what kind of work they do err services they provide? I thought typical paddy field worker is compensated with Rs.150/day in Kosta area, of course it costs landlord more, as he needs to provide tiFFin, CHai/tea, transportation.
Adilabad guy told me that each weekday (except Sunday), he goes to the village center a little before 9am and he takes up any work that any 'mestri' or contractor calls him for. In the non-agricultural season, his work often is loading/unloading lorries that transport anything from grains, vegetables or construction material or moving material/machinery in/out of the factories or mills. Some days he goes to work in other nearby villages in the vehicle arranged by the mEstri but never beyond the main Adilabad town. But the deal is always stuck at his village. He tells me all coolies are particular about chai being served twice - once in the moring and other afternoon. They pack their own lunch from home and eat that during the 1hour lunch slot. Everyone packs up around 6-6:30pm.
Reason I know more details here - he refused my offer of 1lakh loan to buy a used car and run it in Hyderabad. He did some calculations discussing with his friend, an airport cab driver and earning around 15-18k/mo at Hyd, and arrived at the conclusion that he is better off with the 5-6k he is making at his village.
Idéfix- Posts : 8808
Join date : 2012-04-26
Location : Berkeley, CA
Re: Economic inequality in India: a comparative analysis
![]() by rawemotions Fri Aug 02, 2013 7:12 pm
by rawemotions Fri Aug 02, 2013 7:12 pm
NREGA started in 2006 infact from AP. So in that sense you are probably looking at post NREGA wages, which in some sense proves my point. What would be interesting to obtain is typical Farm labour wages in 2005. Please note I am looking at farm labour wages. Anecdotally NREGA has directly contributed to Inflation in Grocery Prices. In addition there was a news report which said that Job Creation under UPA was lower compared to NDA, exactly by the number of jobs available under NREGA. I remember it as around 25 Million.smArtha wrote:rawemotions wrote:
NREGA was a good policy to provide employment to the most ,needy, but by guaranteeing it to everybody, they implemented without forethought. It increased the lower wage limit. Moreover with guaranteed NREGA, the common refrain in Villages in India is that, they are not getting labour for Crop Harvesting, seed laying and similar seasonal activities.
For 2013, the NREGA wages/day in AP is Rs. 149. I know that in 2011 itself unskilled male labor in a remote Adilabad village were asking Rs 300/day for working 9am-6pm schedule. In delta region, it was higher. Granted my data is select samples from two distinct parts of AP. Still, based on these samples, I'm surprised at your observation that people preferred to work for NREGA wages over higher wages that were already prevalent 2 years ago.
http://rjagannathan.in/2011/08/18/did-nrega-kill-as-many-jobs-as-it-created/
Also note that, compared to other wages, once a Farm labour is obtained by a person they are guaranteed labour for that season. So the farm labour wages per day would be slightly lower than general labour wage (which is not guaranteed every day)
Moreover rural wages are NOT standard across India, even for exactly same work, some village in Rural UP or TN or J&K might pay lower wages. So we need to obtain Rural wages in 2006 from a cross section of the country for real impact of NREGA. But clearly CAT and DE are salivating at India's Mechanized Farming Push.
rawemotions- Posts : 1690
Join date : 2011-05-03
Re: Economic inequality in India: a comparative analysis
![]() by Idéfix Fri Aug 02, 2013 7:51 pm
by Idéfix Fri Aug 02, 2013 7:51 pm
I have done the analysis at two levels: first, with the bottom-three subgroups (roughly corresponding to the first post in this thread at the national level). For the sake of convenience, I label this group "poor." Then I will share similar analysis for the single poorest subgroup of all -- I label this group "abject poor."
Let us start with a chart showing the percentage of population that is "poor" in the rural and urban areas of each state.
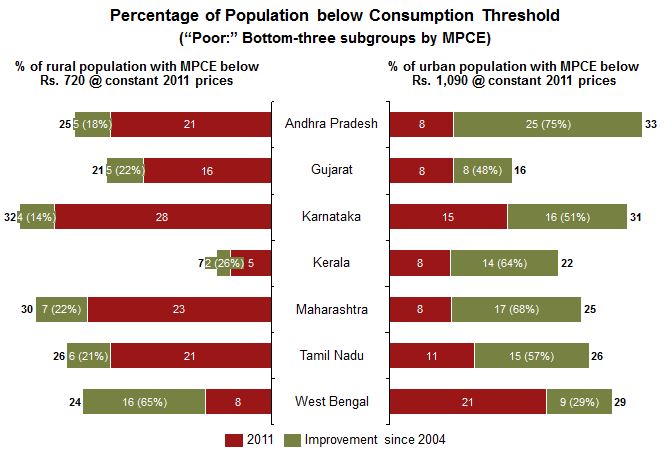
This is how you read the chart. On the left hand side, the total length of each bar (including both colors) shows the percentage of population that was "poor" in 2004 in that state. The red bar shows the percentage that was "poor" in 2011. The green bar, then, represents the improvement between those years. The threshold used for poverty is the same for both years; i.e. the red bar shows what percentage of the population spent Rs. 720 or less a month in 2011, while the sum of red and green shows the percentage of population that spent Rs. 720 at 2011 prices in 2004. The percentage in parentheses in each green bar is the degree of improvement.
My key take-aways from this chart are:
1. Gujarat had less poverty to begin with in 2004, than all states in the chart except Kerala. In urban poverty, Gujarat was the best in 2004.
2. When it comes to reducing rural poverty, Gujarat was behind West Bengal, Maharashtra, and Kerala. Kerala was less poor than Gujarat, but it still made greater progress than Gujarat.
3. When it comes to reducing urban poverty, Gujarat was behind every state in this set except West Bengal. In 2004, AP had twice its urban population in poverty; by 2011, it had caught up with Gujarat on urban poverty. In this period, Gujarat has lost is position as the best on urban poverty; it is now behind Kerala and Maharashtra, and tied with Andhra Pradesh.
... to be continued ...
Sources: NSS reports cited in the first post of this thread.
Idéfix- Posts : 8808
Join date : 2012-04-26
Location : Berkeley, CA
Re: Economic inequality in India: a comparative analysis
![]() by rawemotions Fri Aug 02, 2013 8:05 pm
by rawemotions Fri Aug 02, 2013 8:05 pm
UPA's mess is that they have increased the Debt from 100 Bn$ to 374 Bn$ and short term Debt to 170 BnM.
UPA's another mess is that Job Growth has been pathetic
and Buying power for common man has reduced.
There is no hope for the 18 Million people coming into workforce each other that there will be jobs.
All that they seem to be doing is plotting doles for everyone without figuring out how to fund it, causing debt to further increase.
What do you have to say for such this mess!
rawemotions- Posts : 1690
Join date : 2011-05-03
Re: Economic inequality in India: a comparative analysis
![]() by Idéfix Fri Aug 02, 2013 8:06 pm
by Idéfix Fri Aug 02, 2013 8:06 pm
Here is a chart showing the percentage of population in each state that was in this group in 2004 and in 2011.
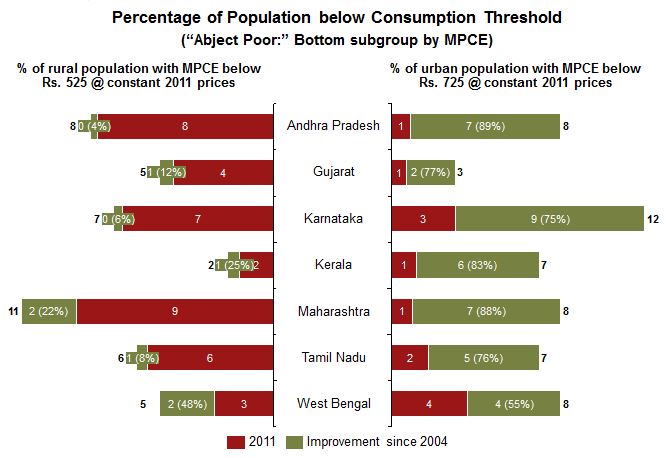
As you can see, the consumption thresholds for this group are lower, at Rs. 525 for rural areas, and Rs. 725 for urban areas.
My key take-aways from this chart are:
1. Gujarat's starting position in 2004 for abject poverty was similar to its position for the broader definition of poverty: best in urban areas, better than all except Kerala in rural areas.
2. When it comes to reducing abject poverty in rural areas, Gujarat is way behind West Bengal, Maharashtra, and Kerala. Again, Kerala was better off to begin with, and yet made more improvement than Gujarat.
3. Gujarat has done better on reducing abject poverty in urban areas, but its progress is still slightly less than that in Andhra Pradesh and Maharashtra. Again, Gujarat has gone from being far ahead of others in 2004, to being almost tied with Maharashtra, Kerala, and Andhra Pradesh when it comes to abject urban poverty.
My conclusions from this analysis are:
1. Gujarat has made good progress on reducing both poverty and abject poverty, in both rural and urban areas.
2. However, its progress is exceeded by that of other states like Maharashtra, Kerala, West Bengal, and Andhra Pradesh.
3. Gujarat has made less progress on combating poverty than states that grew slower than Gujarat. This means that inequality has increased more rapidly in Gujarat than it has in these other states.
Idéfix- Posts : 8808
Join date : 2012-04-26
Location : Berkeley, CA
Re: Economic inequality in India: a comparative analysis
![]() by Idéfix Fri Aug 02, 2013 8:09 pm
by Idéfix Fri Aug 02, 2013 8:09 pm
This is not "some other topic." I am examining the records of the federal government led by UPA and the Gujarat state government led by BJP in combating economic inequality during their rule. You are welcome to continue discussion of the NREGA.rawemotions wrote:We have not completed discussing the NREGA mess and you want to jump to some other topic!
Idéfix- Posts : 8808
Join date : 2012-04-26
Location : Berkeley, CA
Re: Economic inequality in India: a comparative analysis
![]() by goodcitizn Fri Aug 02, 2013 8:19 pm
by goodcitizn Fri Aug 02, 2013 8:19 pm
goodcitizn- Posts : 3263
Join date : 2011-05-03
Re: Economic inequality in India: a comparative analysis
![]() by rawemotions Fri Aug 02, 2013 8:51 pm
by rawemotions Fri Aug 02, 2013 8:51 pm
Idéfix wrote:This is not "some other topic." I am examining the records of the federal government led by UPA and the Gujarat state government led by BJP in combating economic inequality during their rule. You are welcome to continue discussion of the NREGA.natimerawemotions wrote:We have not completed discussing the NREGA mess and you want to jump to some other topic!
Why is it that you talk of inequality and do not want to discuss the unpalatable aspects of NREGA ?
So, your job is just to make some data , post one-sided conclusions without defending them, like the way you ran from acknowledging the stupidity of UPA in increasing the national debt four times. You asked for data but never despite being provided those, you never want to discuss it.
Or May be as Upps mentioned you are angling for Adviser post to sell UPA
Seriously speaking, I do not understand why you want to compare the performance of a country with a state. Shouldn't you be comparing state Vs State?
If Modi can do something with just a state (what matters here is so many initiatives he has taken, whether he personally did it OR empowered someone it indicates a sense of purpose and achievement) , he can do so much with the resources of the entire country, compared to the Moribund rudderless UPA, which seems to care only about flouting constitution, Corruption, Scams, Wrecking the buying power of poor and seniors, giving freebies without funding it, and giving importance to one community over another, and appeasing Political Islamists despite their anti-constitutional deeds.
It is quite clear even from economic data that Congress is interested in dressing up short figures, at the expense of long term economic security and growth.
rawemotions- Posts : 1690
Join date : 2011-05-03
Re: Economic inequality in India: a comparative analysis
![]() by Idéfix Fri Aug 02, 2013 10:15 pm
by Idéfix Fri Aug 02, 2013 10:15 pm
Not sure what metric you are comparing... Maharashtra seems to have done better than Gujarat in both urban and rural poverty reduction.goodcitizn wrote:Overall Gujarat is second, behind Kerala, in total (rural and urban) poverty reduction out of 7 states compared. Not too shabby.
Idéfix- Posts : 8808
Join date : 2012-04-26
Location : Berkeley, CA
Re: Economic inequality in India: a comparative analysis
![]() by Idéfix Fri Aug 02, 2013 10:24 pm
by Idéfix Fri Aug 02, 2013 10:24 pm
I have already said what I had to say about NREGA. Based on the data I have seen, I don't think it's working.rawemotions wrote:Why is it that you talk of inequality and do not want to discuss the unpalatable aspects of NREGA ?
I talk about inequality because it matters to me. You are welcome to talk about topics that matter to you.
I do not "make" the data I post here. These data are available for any interested citizen to look up and analyze. I am taking the data that are out there, presenting the numbers as they are. Some of the data favor Congress, some favor BJP, and some show both in a poor light. I haven't shied away from posting any analysis because it shows Congress in a poor light or because it shows BJP in a good light.rawemotions wrote:So, your job is just to make some data , post one-sided conclusions without defending them, like the way you ran from acknowledging the stupidity of UPA in increasing the national debt four times. You asked for data but never despite being provided those, you never want to discuss it.
I have said half a dozen times to you: if you are concerned about the national debt, research the numbers, show us how the debt changed, and why it is a problem. The onus to convince people that the debt is at a critical level is on you. I am open to believing that it is worth being concerned about, but your 20-point lists of "important" things don't inspire confidence. They make me believe that you are just trying to find things at which BJP looks better than Congress, that's all.
BTW, I am still waiting for you to tell me -- without googling -- which direction the trade deficit turned under Obama and his predecessors, and what that says about their economic stewardship. After all, you kept insisting that it was a "headline number!"
If you read the analysis before commenting on it, you would not have asked this question. The comparisons I have done are:rawemotions wrote:Seriously speaking, I do not understand why you want to compare the performance of a country with a state. Shouldn't you be comparing state Vs State?
- India vs. China, Brazil, Indonesia, etc.
- India under UPA vs. India under NDA, India under PVNR, etc.
- Gujarat vs. Maharashtra, Tamil Nadu, Andhra Pradesh, Karnataka, etc.
- Gujarat under Modi vs. Gujarat under Chimanbhai Patel, etc.
I did not compare the performance of a country to that of a state.
Idéfix- Posts : 8808
Join date : 2012-04-26
Location : Berkeley, CA
Re: Economic inequality in India: a comparative analysis
![]() by Idéfix Fri Aug 02, 2013 11:08 pm
by Idéfix Fri Aug 02, 2013 11:08 pm
Would you cite your sources for this figure? I looked up the national debt figures, and here is a chart showing national debt as a percentage of GDP. The red bars are federal government debt, and the green bars are the sum total of state government debts (excluding state government debts to the federal government, so the total represents overall government debt).rawemotions wrote:like the way you ran from acknowledging the stupidity of UPA in increasing the national debt four times. You asked for data but never despite being provided those, you never want to discuss it.

This chart shows debt as a percentage of GDP declining under UPA, while it peaked under NDA. Do you know what is wrong here?
Source: Reserve Bank of India, Handbook of Statistics on the Indian Economy, Table 237: Select Debt Indicators of the Central and State Governments (as percentage of GDP), here.
Note: I have labeled the years with just one year, although fiscal years in India run April through March. 1991 in this chart represents the fiscal year that began on April 1, 1991 and ended March 31, 1992.
Idéfix- Posts : 8808
Join date : 2012-04-26
Location : Berkeley, CA
Re: Economic inequality in India: a comparative analysis
![]() by rawemotions Fri Aug 02, 2013 11:12 pm
by rawemotions Fri Aug 02, 2013 11:12 pm
Ok! So at least you agree that Jobs Growth and Debt are headline numbers. That is a start! So why don't include them in your "ECONOMIC ANALYSIS" of UPA-1/UPA-2.Idéfix wrote:I have already said what I had to say about NREGA. Based on the data I have seen, I don't think it's working.rawemotions wrote:Why is it that you talk of inequality and do not want to discuss the unpalatable aspects of NREGA ?
I talk about inequality because it matters to me. You are welcome to talk about topics that matter to you.I do not "make" the data I post here. These data are available for any interested citizen to look up and analyze. I am taking the data that are out there, presenting the numbers as they are. Some of the data favor Congress, some favor BJP, and some show both in a poor light. I haven't shied away from posting any analysis because it shows Congress in a poor light or because it shows BJP in a good light.rawemotions wrote:So, your job is just to make some data , post one-sided conclusions without defending them, like the way you ran from acknowledging the stupidity of UPA in increasing the national debt four times. You asked for data but never despite being provided those, you never want to discuss it.
I have said half a dozen times to you: if you are concerned about the national debt, research the numbers, show us how the debt changed, and why it is a problem. The onus to convince people that the debt is at a critical level is on you. I am open to believing that it is worth being concerned about, but your 20-point lists of "important" things don't inspire confidence. They make me believe that you are just trying to find things at which BJP looks better than Congress, that's all.
BTW, I am still waiting for you to tell me -- without googling -- which direction the trade deficit turned under Obama and his predecessors, and what that says about their economic stewardship. After all, you kept insisting that it was a "headline number!"
Regarding trade balance, it is a fact that FEDERAL Reserve/CBO track it, so it is a headline number. You need to ask that question to the FEDS. We were not discussing US economic stewardship, so that is beside the point, and you do not think that I am going for fall of this diversionary tactic. Do you?
These were parameters which you claimed were not important to assess economic performance of a country and you were not interested in searching for that data and including it, but the fact is that FEDERAL reserve and CBO are tracking it like a hawk. The issue was ONLY about that.
So please stop your gratuitous comments. You were caught pants down ignoring vital stats of the economy in which UPA came out poor and here you are sermonizing me!.
You did not answer questions on debt repeatedly and still beating around the bush about it, and since you do NOT want to google and find the data, Let me humour you again and see what you come up with!
On national debt, External debt alone has zoomed from 100 Bn to 390 Bn.
Short term External debt zoomed to 100 Bn.
If you do not think that 390/100 Bn dollar is a problem ? Given that you have agreed that is a headline number which you ignored, kindly do the analysis and come up with your theories! After all you are the "partial economist" here. Isn''t it ?
rawemotions- Posts : 1690
Join date : 2011-05-03
Re: Economic inequality in India: a comparative analysis
![]() by yogi Fri Aug 02, 2013 11:26 pm
by yogi Fri Aug 02, 2013 11:26 pm
Idéfix wrote:Now that the analysis of inequality is done for India as a whole, I will turn my attention to comparing Gujarat with its peers. It is a happenstance that the once-in-five-year NSSs roughly coincided with the times that NDA and UPA-1 took office. This enabled me to compare UPA to its predecessor. We don't have such luck with Modi's tenure in Gujarat. We don't have data rich enough to compare Modi to his predecessors, like I did for GDP growth. What we do have is data from two snapshots: 2004 and 2011. I compared these two datasets for Gujarat and its peers: relatively better-developed major states with decent GDP growth records. By doing this, we avoid comparisons with states where poor people got a raw deal but so did everyone else.
I have done the analysis at two levels: first, with the bottom-three subgroups (roughly corresponding to the first post in this thread at the national level). For the sake of convenience, I label this group "poor." Then I will share similar analysis for the single poorest subgroup of all -- I label this group "abject poor."
Let us start with a chart showing the percentage of population that is "poor" in the rural and urban areas of each state.
This is how you read the chart. On the left hand side, the total length of each bar (including both colors) shows the percentage of population that was "poor" in 2004 in that state. The red bar shows the percentage that was "poor" in 2011. The green bar, then, represents the improvement between those years. The threshold used for poverty is the same for both years; i.e. the red bar shows what percentage of the population spent Rs. 720 or less a month in 2011, while the sum of red and green shows the percentage of population that spent Rs. 720 at 2011 prices in 2004. The percentage in parentheses in each green bar is the degree of improvement.
My key take-aways from this chart are:
1. Gujarat had less poverty to begin with in 2004, than all states in the chart except Kerala. In urban poverty, Gujarat was the best in 2004.
2. When it comes to reducing rural poverty, Gujarat was behind West Bengal, Maharashtra, and Kerala. Kerala was less poor than Gujarat, but it still made greater progress than Gujarat.
3. When it comes to reducing urban poverty, Gujarat was behind every state in this set except West Bengal. In 2004, AP had twice its urban population in poverty; by 2011, it had caught up with Gujarat on urban poverty. In this period, Gujarat has lost is position as the best on urban poverty; it is now behind Kerala and Maharashtra, and tied with Andhra Pradesh.
... to be continued ...
Sources: NSS reports cited in the first post of this thread.
How can we compare all the states on par, when each state has its own defined poverty line?

yogi- Posts : 207
Join date : 2013-01-10
Re: Economic inequality in India: a comparative analysis
![]() by Idéfix Fri Aug 02, 2013 11:26 pm
by Idéfix Fri Aug 02, 2013 11:26 pm
Err, where did I do that, again?rawemotions wrote:Ok! So at least you agree that Jobs Growth and Debt are headline numbers. That is a start!
So, let me get this straight. If somebody tracks a number like a hawk, that is a "headline number" in your book? Hahaha!rawemotions wrote:Regarding trade balance, it is a fact that FEDERAL Reserve/CBO track it, so it is a headline number. You need to ask that question to the FEDS. We were not discussing US economic stewardship, so that is beside the point, and you do not think that I am going for fall of this diversionary tactic. Do you?
These were parameters which you claimed were not important to assess economic performance of a country and you were not interested in searching for that data and including it, but the fact is that FEDERAL reserve and CBO are tracking it like a hawk. The issue was ONLY about that.
There are many things that you can call important. But one of the ways you avoid analysis paralysis is by picking relevant metrics that help you answer the high-level questions, without getting bogged down in metrics that don't help you answer your question. Trade deficit is one of those metrics. Improving the trade deficit does not necessarily indicate good economic performance by a government. The trade deficit got worse under Reagan and Clinton. It got better under George HW Bush. If someone is comparing the economic performance of various administrations, I would ask them to compare changes in GDP, income distribution, and standard of living. Analyzing trade deficit changes would be a distraction.
You need to cite your sources for numbers. If you are talking only about external debt, here is the data from RBI (same table as cited in my last post with a chart of overall debt as percentage of GDP). The chart shows external debt (i.e. not domestic debt) at current exchange rates as a percentage of GDP.rawemotions wrote:You did not answer questions on debt repeatedly and still beating around the bush about it, and since you do NOT want to google and find the data, Let me humour you again and see what you come up with!
On national debt, External debt alone has zoomed from 100 Bn to 390 Bn.
Short term External debt zoomed to 100 Bn.
If you do not think that 390/100 Bn dollar is a problem ?

As you can see, India's external debt has been falling as a percentage of GDP since the beginning of liberalization.
Now, if you tell me your sources, we can figure out where the disconnect is.
Last edited by Idéfix on Fri Aug 02, 2013 11:32 pm; edited 1 time in total
Idéfix- Posts : 8808
Join date : 2012-04-26
Location : Berkeley, CA
Re: Economic inequality in India: a comparative analysis
![]() by Idéfix Fri Aug 02, 2013 11:31 pm
by Idéfix Fri Aug 02, 2013 11:31 pm
This is not based on the official poverty line definitions, which as you say are more complicated.yogi wrote:How can we compare all the states on par, when each state has its own defined poverty line?
This is why I said that I am labeling the bottom subgroups for convenience as "poor" and "abject poor." What my analysis shows is: for two low consumption expenditure levels, how did the percentage of population below them change between 2004 and 2011 in each state? This is a valid way of estimating progress in reducing poverty, while avoiding the subjective complexities of changing poverty line definitions over time and geography.
The officially published estimates of poor people in each state will be different both in 2004 and 2011 from the numbers on my charts, because I am not using the state-by-state poverty level definitions.
Idéfix- Posts : 8808
Join date : 2012-04-26
Location : Berkeley, CA
Re: Economic inequality in India: a comparative analysis
![]() by rawemotions Fri Aug 02, 2013 11:43 pm
by rawemotions Fri Aug 02, 2013 11:43 pm
Ok let us dial back. Since you asked about trade deficit, I thought have accepted that. Do not knowIdéfix wrote:Err, where did I do that, again?rawemotions wrote:Ok! So at least you agree that Jobs Growth and Debt are headline numbers. That is a start!So, let me get this straight. If somebody tracks a number like a hawk, that is a "headline number" in your book? Hahaha!rawemotions wrote:Regarding trade balance, it is a fact that FEDERAL Reserve/CBO track it, so it is a headline number. You need to ask that question to the FEDS. We were not discussing US economic stewardship, so that is beside the point, and you do not think that I am going for fall of this diversionary tactic. Do you?
These were parameters which you claimed were not important to assess economic performance of a country and you were not interested in searching for that data and including it, but the fact is that FEDERAL reserve and CBO are tracking it like a hawk. The issue was ONLY about that.
There are many things that you can call important. But one of the ways you avoid analysis paralysis is by picking relevant metrics that help you answer the high-level questions, without getting bogged down in metrics that don't help you answer your question. Trade deficit is one of those metrics. Improving the trade deficit does not necessarily indicate good economic performance by a government. The trade deficit got worse under Reagan and Clinton. It got better under George HW Bush. If someone is comparing the economic performance of various administrations, I would ask them to compare changes in GDP, income distribution, and standard of living. Analyzing trade deficit changes would be a distraction.
you have a way of providing incomplete answers too, looking at things partially
Please argue that Trade deficit is NOT important with the federal reserve. I certainly believe they know more about a country's economy than me and you put together. I
So what about Job Growth and Debt. is that a distraction too?
rawemotions- Posts : 1690
Join date : 2011-05-03
Re: Economic inequality in India: a comparative analysis
![]() by rawemotions Fri Aug 02, 2013 11:49 pm
by rawemotions Fri Aug 02, 2013 11:49 pm
Idéfix wrote:You need to cite your sources for numbers. If you are talking only about external debt, here is the data from RBI (same table as cited in my last post with a chart of overall debt as percentage of GDP). The chart shows external debt (i.e. not domestic debt) at current exchange rates as a percentage of GDP.rawemotions wrote:You did not answer questions on debt repeatedly and still beating around the bush about it, and since you do NOT want to google and find the data, Let me humour you again and see what you come up with!
On national debt, External debt alone has zoomed from 100 Bn to 390 Bn.
Short term External debt zoomed to 100 Bn.
If you do not think that 390/100 Bn dollar is a problem ?
As you can see, India's external debt has been falling as a percentage of GDP since the beginning of liberalization.
Now, if you tell me your sources, we can figure out where the disconnect is.
My sources are here. Latest Feb 2013 source from RBI itself.
http://rbi.org.in/scripts/BS_PressReleaseDisplay.aspx?prid=28957
Or in RBI's own words around 21% of GDP!
rawemotions- Posts : 1690
Join date : 2011-05-03
Re: Economic inequality in India: a comparative analysis
![]() by Idéfix Fri Aug 02, 2013 11:50 pm
by Idéfix Fri Aug 02, 2013 11:50 pm
Before I answer more of your questions, you need to do two things.rawemotions wrote:Ok let us dial back. Since you asked about trade deficit, I thought have accepted that. Do not knowIdéfix wrote:Err, where did I do that, again?rawemotions wrote:Ok! So at least you agree that Jobs Growth and Debt are headline numbers. That is a start!So, let me get this straight. If somebody tracks a number like a hawk, that is a "headline number" in your book? Hahaha!rawemotions wrote:Regarding trade balance, it is a fact that FEDERAL Reserve/CBO track it, so it is a headline number. You need to ask that question to the FEDS. We were not discussing US economic stewardship, so that is beside the point, and you do not think that I am going for fall of this diversionary tactic. Do you?
These were parameters which you claimed were not important to assess economic performance of a country and you were not interested in searching for that data and including it, but the fact is that FEDERAL reserve and CBO are tracking it like a hawk. The issue was ONLY about that.
There are many things that you can call important. But one of the ways you avoid analysis paralysis is by picking relevant metrics that help you answer the high-level questions, without getting bogged down in metrics that don't help you answer your question. Trade deficit is one of those metrics. Improving the trade deficit does not necessarily indicate good economic performance by a government. The trade deficit got worse under Reagan and Clinton. It got better under George HW Bush. If someone is comparing the economic performance of various administrations, I would ask them to compare changes in GDP, income distribution, and standard of living. Analyzing trade deficit changes would be a distraction.
you have a way of providing incomplete answers too, looking at things partially
Please argue that Trade deficit is NOT important with the federal reserve. I certainly believe they know more about a country's economy than me and you put together. I
So what about Job Growth and Debt. is that a distraction too?
1. Show me where I agreed that jobs growth and debt are "headline numbers." You claimed twice in your previous post that I did.
2. Cite the sources for the debt numbers you have been throwing around.
I don't have to argue with the Fed that trade deficit is not important, because I am sure trade deficit is an important metric for the Fed or RBI to track. I just don't think trade deficit is a metric that you can use to judge the performance of a government. So when your goal is compare the relative performance of multiple governments, analyzing trade deficit won't get you anywhere.
Idéfix- Posts : 8808
Join date : 2012-04-26
Location : Berkeley, CA
Re: Economic inequality in India: a comparative analysis
![]() by rawemotions Fri Aug 02, 2013 11:52 pm
by rawemotions Fri Aug 02, 2013 11:52 pm
Idéfix wrote:Would you cite your sources for this figure? I looked up the national debt figures, and here is a chart showing national debt as a percentage of GDP. The red bars are federal government debt, and the green bars are the sum total of state government debts (excluding state government debts to the federal government, so the total represents overall government debt).rawemotions wrote:like the way you ran from acknowledging the stupidity of UPA in increasing the national debt four times. You asked for data but never despite being provided those, you never want to discuss it.
This chart shows debt as a percentage of GDP declining under UPA, while it peaked under NDA. Do you know what is wrong here?
Source: Reserve Bank of India, Handbook of Statistics on the Indian Economy, Table 237: Select Debt Indicators of the Central and State Governments (as percentage of GDP), here.
Note: I have labeled the years with just one year, although fiscal years in India run April through March. 1991 in this chart represents the fiscal year that began on April 1, 1991 and ended March 31, 1992.
This was a typo. Sorry about that! I meant the external debt here! But you may want to get national debt figures for 2013 too, it might be worse given the largesse they gave to UP and other Communal schemes central and other states (Kerala/UP) are cooking up.
Last edited by rawemotions on Sat Aug 03, 2013 12:00 am; edited 1 time in total
rawemotions- Posts : 1690
Join date : 2011-05-03
Re: Economic inequality in India: a comparative analysis
![]() by Idéfix Fri Aug 02, 2013 11:57 pm
by Idéfix Fri Aug 02, 2013 11:57 pm
This again exposes your half-baked understanding of the concepts involved. The source you have cited refers to ALL external debt, not just public (or national) debt. In other words, it includes the borrowings of all Indian companies from overseas lenders. It includes the fixed deposits that NRIs make in Indian banks. You referred to this as national debt multiple times:rawemotions wrote:Idéfix wrote:You need to cite your sources for numbers. If you are talking only about external debt, here is the data from RBI (same table as cited in my last post with a chart of overall debt as percentage of GDP). The chart shows external debt (i.e. not domestic debt) at current exchange rates as a percentage of GDP.rawemotions wrote:You did not answer questions on debt repeatedly and still beating around the bush about it, and since you do NOT want to google and find the data, Let me humour you again and see what you come up with!
On national debt, External debt alone has zoomed from 100 Bn to 390 Bn.
Short term External debt zoomed to 100 Bn.
If you do not think that 390/100 Bn dollar is a problem ?
As you can see, India's external debt has been falling as a percentage of GDP since the beginning of liberalization.
Now, if you tell me your sources, we can figure out where the disconnect is.
My sources are here. Latest Feb 2013 source from RBI itself.
http://rbi.org.in/scripts/BS_PressReleaseDisplay.aspx?prid=28957
Or in RBI's own words around 21% of GDP!
rawemotions wrote:On national debt, External debt alone has zoomed from 100 Bn to 390 Bn.
rawemotions wrote:like the way you ran from acknowledging the stupidity of UPA in increasing the national debt four times
You don't even read -- or understand -- your sources properly. Your own source says this very clearly.
In terms of major components, the share of external commercial borrowings continued to be the highest at 31.0 per cent of total external debt, followed by short term debt (24.8 per cent) and NRI deposits (18.2 per cent).
Read that carefully. At least half of that external debt is clearly not government borrowing; 31% is commercial borrowing, 18% is NRI deposits.
Next time I suggest you do a more thorough reading of sources, and try to understand what the material before you draw conclusions from it.
Finally, you accused me of running from acknowledging "the stupidity" of UPA in increasing the "national debt" by four times. Now, will you acknowledge your stupidity in getting the debt thing all wrong, or are you going to run from it?
Idéfix- Posts : 8808
Join date : 2012-04-26
Location : Berkeley, CA
Re: Economic inequality in India: a comparative analysis
![]() by Idéfix Sat Aug 03, 2013 12:00 am
by Idéfix Sat Aug 03, 2013 12:00 am
Haha, that was no typo. You mentioned several times that national debt had increased by four times. Apart from the two examples I gave in my previous post, here is another one where you made the same claim:rawemotions wrote:This was a typo. I meant the external debt here! But you may want to get national debt figures for 2013 too, it might be worse given the largesse they gave to UP and other Communal schemes central and other states (Kerala/UP) are cooking up.
So do you still want to pass it off as a typo?rawemotions wrote:UPA's mess is that they have increased the Debt from 100 Bn$ to 374 Bn$ and short term Debt to 170 BnM.
Data for the current fiscal 2013-'14 won't become available until after next summer. We should see the revised estimates and final numbers for 2012-'13 come through in the next quarter or so. I will be happy to take a look at them and see if anything changes in a big way.
Idéfix- Posts : 8808
Join date : 2012-04-26
Location : Berkeley, CA
Re: Economic inequality in India: a comparative analysis
![]() by rawemotions Sat Aug 03, 2013 12:11 am
by rawemotions Sat Aug 03, 2013 12:11 am
There is no confusion. From the beginning I had been referring to this number.Idéfix wrote:This again exposes your half-baked understanding of the concepts involved. The source you have cited refers to ALL external debt, not just public (or national) debt. In other words, it includes the borrowings of all Indian companies from overseas lenders. It includes the fixed deposits that NRIs make in Indian banks. You referred to this as national debt multiple times:rawemotions wrote:Idéfix wrote:You need to cite your sources for numbers. If you are talking only about external debt, here is the data from RBI (same table as cited in my last post with a chart of overall debt as percentage of GDP). The chart shows external debt (i.e. not domestic debt) at current exchange rates as a percentage of GDP.rawemotions wrote:You did not answer questions on debt repeatedly and still beating around the bush about it, and since you do NOT want to google and find the data, Let me humour you again and see what you come up with!
On national debt, External debt alone has zoomed from 100 Bn to 390 Bn.
Short term External debt zoomed to 100 Bn.
If you do not think that 390/100 Bn dollar is a problem ?
As you can see, India's external debt has been falling as a percentage of GDP since the beginning of liberalization.
Now, if you tell me your sources, we can figure out where the disconnect is.
My sources are here. Latest Feb 2013 source from RBI itself.
http://rbi.org.in/scripts/BS_PressReleaseDisplay.aspx?prid=28957
Or in RBI's own words around 21% of GDP!rawemotions wrote:On national debt, External debt alone has zoomed from 100 Bn to 390 Bn.rawemotions wrote:like the way you ran from acknowledging the stupidity of UPA in increasing the national debt four times
You don't even read -- or understand -- your sources properly. Your own source says this very clearly.
In terms of major components, the share of external commercial borrowings continued to be the highest at 31.0 per cent of total external debt, followed by short term debt (24.8 per cent) and NRI deposits (18.2 per cent).
Read that carefully. At least half of that external debt is clearly not government borrowing; 31% is commercial borrowing, 18% is NRI deposits.
Next time I suggest you do a more thorough reading of sources, and try to understand what the material before you draw conclusions from it.
Finally, you accused me of running from acknowledging "the stupidity" of UPA in increasing the "national debt" by four times. Now, will you acknowledge your stupidity in getting the debt thing all wrong, or are you going to run from it?
From a sovereign risk aspect everything in external debt matters. This is the number which has gone up by 4 times.
Why does government ask for 9.5% interest denominated NRI deposits because
they need that to shore up Rupee and finance imports ?
Why do companies go abroad for debt, exposing themselves to exchange rate variations (and now suffering because of that), they did not get capital at reasonable interest?
All of these are the end result of mis-management of the economy by the UPA government, despite getting 8 years.
If you have a sudden outgo of any of these components, we would have a run on the Rupee.
I meant to include all external debt of the nation as mentioned in the RBI study and NOT one portion of it. For me that in includes everything ECB, NRI Deposits etc.. All of these result in Foreign exchange outgo. There was no confusion here. I am not responsible if you construe national debt as only including one component (the Sovereign Debt)
You should have then use the term Sovereign Debt. the term used by RBI for your graphs.
rawemotions- Posts : 1690
Join date : 2011-05-03
Page 1 of 2 • 1, 2 ![]()
» India’s next big challenge: inequality
» India’s Eternal Inequality
» Economic Agenda for India 2020
» India's GDP growth and UPA's economic record