Economic inequality in India: a comparative analysis
Page 2 of 2 •  1, 2
1, 2
Re: Economic inequality in India: a comparative analysis
![]() by rawemotions Sat Aug 03, 2013 12:37 am
by rawemotions Sat Aug 03, 2013 12:37 am
You could have said that if I had only quoted the name and not the figure. but from the first message I had been quoting the figure also. We all know Indians total debt is much more than 374 Bn, and close to 70-80% of GDP.Idéfix wrote:Haha, that was no typo. You mentioned several times that national debt had increased by four times. Apart from the two examples I gave in my previous post, here is another one where you made the same claim:rawemotions wrote:This was a typo. I meant the external debt here! But you may want to get national debt figures for 2013 too, it might be worse given the largesse they gave to UP and other Communal schemes central and other states (Kerala/UP) are cooking up.So do you still want to pass it off as a typo?rawemotions wrote:UPA's mess is that they have increased the Debt from 100 Bn$ to 374 Bn$ and short term Debt to 170 BnM.
Data for the current fiscal 2013-'14 won't become available until after next summer. We should see the revised estimates and final numbers for 2012-'13 come through in the next quarter or so. I will be happy to take a look at them and see if anything changes in a big way.
All along I was referring to total external debt.
rawemotions- Posts : 1690
Join date : 2011-05-03
Re: Economic inequality in India: a comparative analysis
![]() by goodcitizn Sat Aug 03, 2013 3:59 pm
by goodcitizn Sat Aug 03, 2013 3:59 pm
Excerpts:
The Planning Commission has once again embarrassed us with its claims of decline in poverty by 2011-12 to grossly unrealistic levels of 13.7 per cent of population in urban areas and 25.7 per cent in rural areas, using monthly poverty lines of Rs. 1000 and Rs. 816 respectively, or Rs. 33.3 and Rs. 27.2 per day. These princely amounts will pay for one urban male haircut while they are supposed to meet all daily food and non-food living costs. The poverty decline claimed is huge, a full 8 per cent points fall in rural areas over the two years since 2009-10, and a 7 per cent points fall in urban areas, never mind that these two years saw the aftermath of drought, poor employment growth and exceptionally rapid food price rise. The logically incorrect estimation method that the Commission continues to use makes it an absolute certainty that in another four years, when the 2014-15 survey results become available, it will claim that urban poverty is near zero and rural poverty only around 12 per cent. This will be the case regardless of any rise in actual deprivation and intensification of actual poverty.
All official claims of low poverty level and poverty decline are quite spurious, solely the result of mistaken method. In reality, poverty is high and rising. By 2009-10, after meeting all essential non-food expenses (manufactured necessities, utilities, rent, transport, health, education), 75.5 per cent of rural persons could not consume enough food to give 2200 calories per day, while 73 per cent of all urban persons could not access 2100 calories per day. The comparable percentages for 2004-5 were 69.5 rural and 64.5 urban, so there has been a substantial poverty rise. Once the NSS releases its nutritional intake data for 2011-12 we can see the change up to that year, but given the high rate of inflation and sluggish job growth, the situation is likely to be as bad, if not worse. Our figures are obtained by applying the Planning Commission’s own original definition of poverty line. Given the rapidly rising cost of privatised health care, education and utilities (electricity, petrol, gas), combined with high food price inflation and exclusion of the majority of the actually poor from affordable PDS grain, it is hardly surprising that the bulk of the population is getting more impoverished, and its nutritional level is declining faster than before.
What is the basic problem with the Planning Commission’s method which produces its low and necessarily declining estimates, regardless of ground reality? The Commission in practice gave up its own definition of the poverty line which was applied only once — to get the 1973-74 estimate. After that, it has never looked over the next 40 years even once for deriving poverty lines at the actual current spending level, which will allow the population to maintain the same standard of living in terms of nutrition after meeting all non-food costs — even though these data have been available in every five-yearly NSS survey.
The Commission instead simply applied price indices to bring forward the base year monthly poverty lines of Rs 49 rural and Rs.56 urban in 1973-74. The Tendulkar committee did not change this aspect; it merely altered the specific index.
Price indexation does not capture the actual rise in the cost of living over long periods. Those doing the poverty estimates would be the first to protest if their own salaries were indexed only through dearness allowance. A fairly high level government employee getting Rs.1,000 a month in 1973-74 would get Rs.18,000 a month today if the salary was only indexed. The fact that indexing does not capture the actual rise in the cost of living is recognised by the government itself by appointing decadal Pay Commissions which push up the entire structure of salaries — an employee in the same position today gets not Rs.18,000 but a four times higher salary of over Rs.70,000. Yet those doing poverty estimates continue to maintain the fiction that the same standard of living can be accessed by the poor by merely indexing the original poverty line, and they never mention the severely lowered nutritional access at their poverty lines which, by now, are destitution lines.
The fact is that official poverty lines give command over time to a lower and lower standard of living. With a steadily lowered standard, the poverty figures will always show apparent improvement even when actual deprivation is worsening. A school child knows that if last year’s percentage of students passing the annual examination is to be compared to this year’s percentage, the pass mark should be the same. The school principal cannot quietly lower the pass mark without informing the public, say from 50 out of hundred last year to 40 this year, and then claim that the school’s performance has improved because 80 per cent of students are recorded as ‘passed’ this year at the clandestinely lowered pass mark, compared to 75 per cent of students last year. If, at the same pass mark of 50, we find that 70 per cent of students have passed this year, we are justified in saying that the performance, far from improving, has worsened. If the school is allowed to continue with its wrong method, and lower the pass mark further next year, and again the next year, so ad infinitum, it is eventually bound to record 100 per cent pass and zero failure.
The case is exactly the same with the official poverty lines as with the pass mark: the poverty lines have been lowered continuously below the standard over a very long period of 40 years. ‘Poverty’ so measured is bound to disappear from India even though in reality it may be very high and worsening over time. The Commission’s monthly poverty line for urban Delhi state in 2009-10 is Rs.1040 — but a consumer spending this much could afford food that gave only 1400 calories a day after meeting all other fast rising expenses. The correct poverty line is Rs.5,000 for accessing 2100 calories, and a staggering 90 per cent of people have been pushed below this, compared to 57 per cent below the correct poverty line of Rs.1150 in 2004-05. Given the very high rate of food price inflation plus the rising cost of privatised medical care and utilities, it is not surprising that people are being forced to cut back on food, and the average calorie intake in urban Delhi has fallen to an all-time low of 1756. While a high-visibility minority of households with stable incomes is able to hire-purchase multiple cars per household and enjoy other durable goods, the vast working underclass which is invisible to the rich is struggling to survive. Fifty five per cent of the urban population cannot access even 1800 calories today, compared to less than a quarter in that position a mere five years earlier.
(Utsa Patnaik is Professor Emeritus, Jawaharlal Nehru University)
http://www.thehindu.com/opinion/lead/the-dishonesty-in-counting-the-poor/article4967454.ece?ref=relatedNews
goodcitizn- Posts : 3263
Join date : 2011-05-03
Re: Economic inequality in India: a comparative analysis
![]() by smArtha Sun Aug 04, 2013 2:24 pm
by smArtha Sun Aug 04, 2013 2:24 pm
Idéfix wrote:The surveys break down the bottom 20% into three subgroups, and each subgroup has numbers for rural and urban consumers. This is how you read the chart: the 0-5th percentile group in rural areas spent on average just Rs. 469 a month in 2011. That is on everything: food, clothes, shelter, utilities, entertainment, taxes, and anything else.
Can you verify the highlighted statement above. Are you certain that these expenses include everything spent per capita per month? The reason I'm asking is, going by this, someone who spends about Rs.10k/month per person is already in the > 95th percentile of the urban population. If you take a family of 6-people say parents, grand parents, two kids (let's count them as 1 adult) then at about Rs 50k monthly expenses in, say Hyderabad, they are already in the top 5-percentile of the population. Sampling a few friends back home working across IT, ITES, Media, Construction, Banking, Accounting, Legal, Teaching, Public Sector professions - I don't think anyone feels that Rs.50k/month is enough to meet the monthly expenses of a family of the above size and composition. In that segment, House rent + school fee itself accounts for a about Rs25-30k/mo on an average.
Regarding the growth rates in charts, should this not be a per year average rate for correct comparison something like the CAGR? For eg: in the rural 10-20th percentile, NDA had 5 years to achieve 10% growth and UPA took 8 years for the 11% growth. Clearly, NDA is better here. Also, should we not seperate UPA-1 and UPA-2 to get a picture if the perception on UPA-2 is valid or not. I think it is now an accepted fact that common people were by and large relatively happier with the UPA-1 economics over that of NDA.
smArtha- Posts : 1229
Join date : 2013-07-29
Re: Economic inequality in India: a comparative analysis
![]() by Idéfix Sun Aug 04, 2013 2:36 pm
by Idéfix Sun Aug 04, 2013 2:36 pm
Haha, she makes the point well. This is exactly why I picked two particular consumption levels, and held those constant across the two snapshots from 2004 and 2011. So the change we see is not because we decide to reset what we call poverty, but it is the change in actual consumption levels of the population.goodcitizn wrote:Interesting article in The Hindu, July 30, 2013
Excerpts:
The Planning Commission has once again embarrassed us with its claims of decline in poverty by 2011-12 to grossly unrealistic levels of 13.7 per cent of population in urban areas and 25.7 per cent in rural areas, using monthly poverty lines of Rs. 1000 and Rs. 816 respectively, or Rs. 33.3 and Rs. 27.2 per day. These princely amounts will pay for one urban male haircut while they are supposed to meet all daily food and non-food living costs. The poverty decline claimed is huge, a full 8 per cent points fall in rural areas over the two years since 2009-10, and a 7 per cent points fall in urban areas, never mind that these two years saw the aftermath of drought, poor employment growth and exceptionally rapid food price rise. The logically incorrect estimation method that the Commission continues to use makes it an absolute certainty that in another four years, when the 2014-15 survey results become available, it will claim that urban poverty is near zero and rural poverty only around 12 per cent. This will be the case regardless of any rise in actual deprivation and intensification of actual poverty.
All official claims of low poverty level and poverty decline are quite spurious, solely the result of mistaken method. In reality, poverty is high and rising. By 2009-10, after meeting all essential non-food expenses (manufactured necessities, utilities, rent, transport, health, education), 75.5 per cent of rural persons could not consume enough food to give 2200 calories per day, while 73 per cent of all urban persons could not access 2100 calories per day. The comparable percentages for 2004-5 were 69.5 rural and 64.5 urban, so there has been a substantial poverty rise. Once the NSS releases its nutritional intake data for 2011-12 we can see the change up to that year, but given the high rate of inflation and sluggish job growth, the situation is likely to be as bad, if not worse. Our figures are obtained by applying the Planning Commission’s own original definition of poverty line. Given the rapidly rising cost of privatised health care, education and utilities (electricity, petrol, gas), combined with high food price inflation and exclusion of the majority of the actually poor from affordable PDS grain, it is hardly surprising that the bulk of the population is getting more impoverished, and its nutritional level is declining faster than before.
What is the basic problem with the Planning Commission’s method which produces its low and necessarily declining estimates, regardless of ground reality? The Commission in practice gave up its own definition of the poverty line which was applied only once — to get the 1973-74 estimate. After that, it has never looked over the next 40 years even once for deriving poverty lines at the actual current spending level, which will allow the population to maintain the same standard of living in terms of nutrition after meeting all non-food costs — even though these data have been available in every five-yearly NSS survey.
The Commission instead simply applied price indices to bring forward the base year monthly poverty lines of Rs 49 rural and Rs.56 urban in 1973-74. The Tendulkar committee did not change this aspect; it merely altered the specific index.
Price indexation does not capture the actual rise in the cost of living over long periods. Those doing the poverty estimates would be the first to protest if their own salaries were indexed only through dearness allowance. A fairly high level government employee getting Rs.1,000 a month in 1973-74 would get Rs.18,000 a month today if the salary was only indexed. The fact that indexing does not capture the actual rise in the cost of living is recognised by the government itself by appointing decadal Pay Commissions which push up the entire structure of salaries — an employee in the same position today gets not Rs.18,000 but a four times higher salary of over Rs.70,000. Yet those doing poverty estimates continue to maintain the fiction that the same standard of living can be accessed by the poor by merely indexing the original poverty line, and they never mention the severely lowered nutritional access at their poverty lines which, by now, are destitution lines.
The fact is that official poverty lines give command over time to a lower and lower standard of living. With a steadily lowered standard, the poverty figures will always show apparent improvement even when actual deprivation is worsening. A school child knows that if last year’s percentage of students passing the annual examination is to be compared to this year’s percentage, the pass mark should be the same. The school principal cannot quietly lower the pass mark without informing the public, say from 50 out of hundred last year to 40 this year, and then claim that the school’s performance has improved because 80 per cent of students are recorded as ‘passed’ this year at the clandestinely lowered pass mark, compared to 75 per cent of students last year. If, at the same pass mark of 50, we find that 70 per cent of students have passed this year, we are justified in saying that the performance, far from improving, has worsened. If the school is allowed to continue with its wrong method, and lower the pass mark further next year, and again the next year, so ad infinitum, it is eventually bound to record 100 per cent pass and zero failure.
The case is exactly the same with the official poverty lines as with the pass mark: the poverty lines have been lowered continuously below the standard over a very long period of 40 years. ‘Poverty’ so measured is bound to disappear from India even though in reality it may be very high and worsening over time. The Commission’s monthly poverty line for urban Delhi state in 2009-10 is Rs.1040 — but a consumer spending this much could afford food that gave only 1400 calories a day after meeting all other fast rising expenses. The correct poverty line is Rs.5,000 for accessing 2100 calories, and a staggering 90 per cent of people have been pushed below this, compared to 57 per cent below the correct poverty line of Rs.1150 in 2004-05. Given the very high rate of food price inflation plus the rising cost of privatised medical care and utilities, it is not surprising that people are being forced to cut back on food, and the average calorie intake in urban Delhi has fallen to an all-time low of 1756. While a high-visibility minority of households with stable incomes is able to hire-purchase multiple cars per household and enjoy other durable goods, the vast working underclass which is invisible to the rich is struggling to survive. Fifty five per cent of the urban population cannot access even 1800 calories today, compared to less than a quarter in that position a mere five years earlier.
(Utsa Patnaik is Professor Emeritus, Jawaharlal Nehru University)
http://www.thehindu.com/opinion/lead/the-dishonesty-in-counting-the-poor/article4967454.ece?ref=relatedNews

Idéfix- Posts : 8808
Join date : 2012-04-26
Location : Berkeley, CA
Re: Economic inequality in India: a comparative analysis
![]() by Idéfix Sun Aug 04, 2013 2:43 pm
by Idéfix Sun Aug 04, 2013 2:43 pm
It is more true at the lower levels of consumption than at the higher levels. That is because NSS asks people about money that they spent on a set of items. That set of items tends to contain all essentials, but only some luxuries. So people may be leaving out some luxury spending items (e.g. broadband internet) while all groups report basic spending items (e.g. rice). The other aspect is that people who spend more are likely not to remember all their spending avenues for the same item; it is easier for people who never eat out at restaurants to remember what they spent on food, because they buy it at the grocery store, while those who regularly eat out at restaurants may or may not include that spending under food. As indicators of both income and true consumption, the data are more reliable at the bottom end of the consumption range.smArtha wrote:Idéfix wrote:The surveys break down the bottom 20% into three subgroups, and each subgroup has numbers for rural and urban consumers. This is how you read the chart: the 0-5th percentile group in rural areas spent on average just Rs. 469 a month in 2011. That is on everything: food, clothes, shelter, utilities, entertainment, taxes, and anything else.
Can you verify the highlighted statement above.
That's a good point, I will show a different chart with the CAGRs. I don't think we have enough data to separate UPA-1 from UPA-2 because of the survey timing.smArtha wrote:Regarding the growth rates in charts, should this not be a per year average rate for correct comparison something like the CAGR? For eg: in the rural 10-20th percentile, NDA had 5 years to achieve 10% growth and UPA took 8 years for the 11% growth. Clearly, NDA is better here. Also, should we not seperate UPA-1 and UPA-2 to get a picture if the perception on UPA-2 is valid or not. I think it is now an accepted fact that common people were by and large relatively happier with the UPA-1 economics over that of NDA.
Idéfix- Posts : 8808
Join date : 2012-04-26
Location : Berkeley, CA
Re: Economic inequality in India: a comparative analysis
![]() by Idéfix Sun Aug 04, 2013 2:53 pm
by Idéfix Sun Aug 04, 2013 2:53 pm
From the beginning, you have been citing an external debt number (only 20% of which is part of national debt; the rest is private debt), and calling it national debt! Not only did you use the wrong term, but you also showed from your comments that your understanding was wrong. You blamed "the stupidity" of the government for increasing "national debt" by four times. When in fact the sovereign portion of external debt has decreased under UPA as a percentage of GDP!rawemotions wrote:There is no confusion. From the beginning I had been referring to this number.
When that got exposed, you first claimed that that was a typo (hahaha!), and when I showed how that won't fly, now you claim that "there is no confusion" and you intended it all along, and blame me for not using the term sovereign debt! You should stop running from acknowledging your stupidity on this matter.
Here is the definition of the term national debt.
Government debt (also known as public debt and national debt) is the debt owed by a central government.
Companies take advantage of changes in the global capital markets, and borrow the most attractive funds. That is a good thing for India. Why should companies not take advantage of foreign debt capital? Is it your position that the Indian government should stop Indian companies from going abroad for debt and / or equity investments?rawemotions wrote:Why do companies go abroad for debt, exposing themselves to exchange rate variations (and now suffering because of that), they did not get capital at reasonable interest?
You are welcome to believe that the UPA mismanaged the economy. But the data show greater GDP growth and falling national debt under the UPA.rawemotions wrote:All of these are the end result of mis-management of the economy by the UPA government, despite getting 8 years.
Idéfix- Posts : 8808
Join date : 2012-04-26
Location : Berkeley, CA
Re: Economic inequality in India: a comparative analysis
![]() by Idéfix Sun Aug 04, 2013 10:17 pm
by Idéfix Sun Aug 04, 2013 10:17 pm
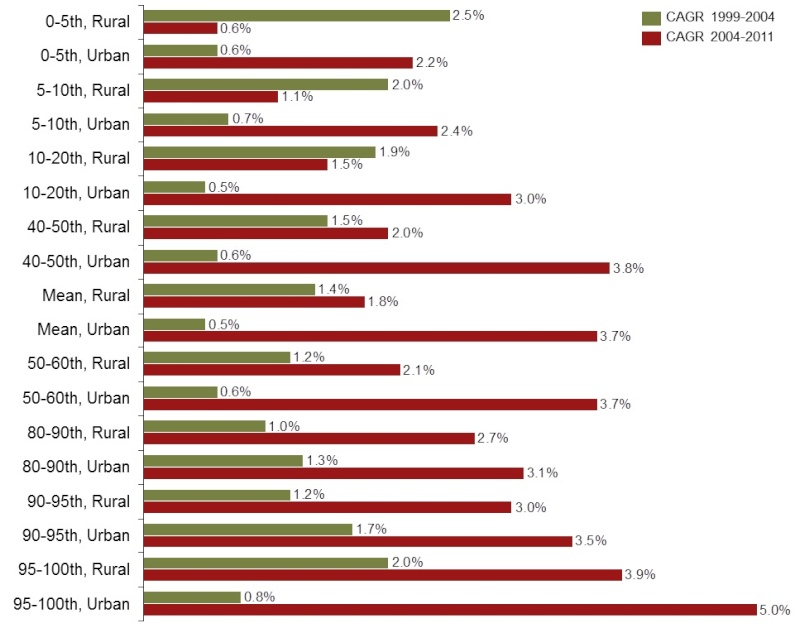
From this chart, it is clear that:
1. NDA outperformed UPA in terms of improving the condition of the bottom 20% in rural areas.
2. For all other segments -- including urban poor -- improvements were more rapid under UPA than NDA.
3. The largest gaps are for the middle- and high-consumption groups. Their consumption grew much faster under UPA than NDA. This means that the gap between rich and poor widened more under UPA than under NDA.
4. Mean consumption across all groups increased more under UPA than NDA for both rural and urban people.
5. Growth rates in mean consumption were higher for rural areas than urban areas under NDA, while urban growth was much faster under UPA.
These data again highlight some counterfactual perceptions. Middle class urban people tend to favor NDA over UPA, but their economic situation improved faster under UPA based on these data. My explanation for this is that the urban middle class does not base its preferences entirely on checkbook issues, and it finds NDA attractive for other reasons besides economic performance.
Idéfix- Posts : 8808
Join date : 2012-04-26
Location : Berkeley, CA
Re: Economic inequality in India: a comparative analysis
![]() by truthbetold Sun Aug 04, 2013 10:46 pm
by truthbetold Sun Aug 04, 2013 10:46 pm
Nda years contains nuclear sanction years with subpar economic performance.
so if you are looking for nda policies you should use only 2002,2003 and 2004 economic data vs upa economic data.
Few other facts:
Both bjp and upa are far to the left of western democracies. Nda is significantly left of bjp. So I contend that any differences in above. Charts is because of big picture Gdp growth rate and not due to any significant resource allocations.
truthbetold- Posts : 6799
Join date : 2011-06-07
Re: Economic inequality in India: a comparative analysis
![]() by rawemotions Sun Aug 04, 2013 10:55 pm
by rawemotions Sun Aug 04, 2013 10:55 pm
Idéfix wrote:Smartha suggested looking at the CAGRs of average MPCE by percentile class, for a better comparison of NDA and UPA. Here is a chart that shows the CAGR of average monthly per-capita consumer expenditure in each subgroup.
From this chart, it is clear that:
1. NDA outperformed UPA in terms of improving the condition of the bottom 20% in rural areas.
2. For all other segments -- including urban poor -- improvements were more rapid under UPA than NDA.
3. The largest gaps are for the middle- and high-consumption groups. Their consumption grew much faster under UPA than NDA. This means that the gap between rich and poor widened more under UPA than under NDA.
4. Mean consumption across all groups increased more under UPA than NDA for both rural and urban people.
5. Growth rates in mean consumption were higher for rural areas than urban areas under NDA, while urban growth was much faster under UPA.
These data again highlight some counterfactual perceptions. Middle class urban people tend to favor NDA over UPA, but their economic situation improved faster under UPA based on these data. My explanation for this is that the urban middle class does not base its preferences entirely on checkbook issues, and it finds NDA attractive for other reasons besides economic performance.
Your conclusions are incorrect.
Ask any Middle class person and almost everybody agrees unanimously that Buying power has gone down and inflation does not reflect the degradation in buying power.
This is because the essential items like pulses/cereals/oil/poultry/food and groceries, that Middle class buys in urban/semi-urban areas, have gone up by 300% since UPA came to power.
Your charts only consider Inflation as one number, but does not account for this in anyway.
rawemotions- Posts : 1690
Join date : 2011-05-03
Re: Economic inequality in India: a comparative analysis
![]() by rawemotions Sun Aug 04, 2013 11:01 pm
by rawemotions Sun Aug 04, 2013 11:01 pm
rawemotions- Posts : 1690
Join date : 2011-05-03
Re: Economic inequality in India: a comparative analysis
![]() by Idéfix Sun Aug 04, 2013 11:02 pm
by Idéfix Sun Aug 04, 2013 11:02 pm
This is wrong. The numbers do account for inflation. These charts indicate the percentage of population that was at a certain level of monthly consumption, that level being compared after accounting for inflation.rawemotions wrote:Your charts only consider Inflation as one number, but does not account for this in anyway.
Idéfix- Posts : 8808
Join date : 2012-04-26
Location : Berkeley, CA
Re: Economic inequality in India: a comparative analysis
![]() by Idéfix Sun Aug 04, 2013 11:08 pm
by Idéfix Sun Aug 04, 2013 11:08 pm
These suggested adjustments quickly get us into very subjective territory. One could argue on the other side that the Great Recession and global financial crisis should be excluded from the UPA years, because that was out of their control. It is also possible to argue that nuclear tests were NDA policy, not something out of their control, so any fallout from that in terms of impact on the economy reflects on NDA's economic performance. This is why in all these comparisons, I am not cherry-picking good years for either side, and I am comparing them straight up in the fairest way allowed by the available data.truthbetold wrote:Idefix,
Nda years contains nuclear sanction years with subpar economic performance.
so if you are looking for nda policies you should use only 2002,2003 and 2004 economic data vs upa economic data.
Yes, this may be the truth. I was trying to examine if UPA's much-vaunted pro-poor, pro-rural policies show any impact on the income of the poorest groups. I find no strong evidence in the data for it. If anything, the rural poor saw faster improvement under NDA than under UPA.truthbetold wrote:Few other facts:
Both bjp and upa are far to the left of western democracies. Nda is significantly left of bjp. So I contend that any differences in above. Charts is because of big picture Gdp growth rate and not due to any significant resource allocations.
Idéfix- Posts : 8808
Join date : 2012-04-26
Location : Berkeley, CA
Re: Economic inequality in India: a comparative analysis
![]() by rawemotions Sun Aug 04, 2013 11:23 pm
by rawemotions Sun Aug 04, 2013 11:23 pm
Something is NOT right in your charts. If you actually referred to Sovereign External Debt, the table in the iRBI link gives the following Sovereign debt to GDP percentages from 2007 till 2013. Whereas your chart gives 3% for 2011 instead of 4.5%. It looks you are NOT including some component in sovereign External debt. So even in Sovereign External Debt, you need to fix your charts.rawemotions wrote:Idéfix wrote:You need to cite your sources for numbers. If you are talking only about external debt, here is the data from RBI (same table as cited in my last post with a chart of overall debt as percentage of GDP). The chart shows external debt (i.e. not domestic debt) at current exchange rates as a percentage of GDP.rawemotions wrote:You did not answer questions on debt repeatedly and still beating around the bush about it, and since you do NOT want to google and find the data, Let me humour you again and see what you come up with!
On national debt, External debt alone has zoomed from 100 Bn to 390 Bn.
Short term External debt zoomed to 100 Bn.
If you do not think that 390/100 Bn dollar is a problem ?
As you can see, India's external debt has been falling as a percentage of GDP since the beginning of liberalization.
Now, if you tell me your sources, we can figure out where the disconnect is.
My sources are here. Latest Feb 2013 source from RBI itself.
http://rbi.org.in/scripts/BS_PressReleaseDisplay.aspx?prid=28957
Or in RBI's own words around 21% of GDP!

There is another figure that is more alarming. In external debt, the ratio of short term to total debt has jumped 8-fold
from 3.9 in 2004 to 24.8 in 2013.
Sr. No. Components | End-March | ||||||
2007 | 2008 | 2009 | 2010 | 2011 R | 2012 PR | 2013 PR | |
1 | 2 | 3 | 4 | 5 | 6 | 7 | 8 |
| A. Sovereign Debt (I+II) | 49,360 | 58,070 | 55,870 | 67,067 | 78,072 | 81,895 | 81,654 |
| (As a percentage of GDP) | 5.0 | 4.7 | 5.1 | 4.7 | 4.5 | 4.7 | 4.4 |
| I. External Debt on Government Account under External Assistance | 46,155 | 52,538 | 51,816 | 55,235 | 62,295 | 63,374 | 61,336 |
| II. Other Government External Debt @ | 3,205 | 5,529 | 4,054 | 11,832 | 15,777 | 18,521 | 20,319 |
rawemotions- Posts : 1690
Join date : 2011-05-03
Re: Economic inequality in India: a comparative analysis
![]() by Idéfix Sun Aug 04, 2013 11:52 pm
by Idéfix Sun Aug 04, 2013 11:52 pm
I have already provided the source for my chart. From a previous post:rawemotions wrote:Something is NOT right in your charts. If you actually referred to Sovereign External Debt, the table in the iRBI link gives the following Sovereign debt to GDP percentages from 2007 till 2013. Whereas your chart gives 3% for 2011 instead of 4.5%. It looks you are NOT including some component in sovereign External debt. So even in Sovereign External Debt, you need to fix your charts.
Source: Reserve Bank of India, Handbook of Statistics on the Indian Economy, Table 237: Select Debt Indicators of the Central and State Governments (as percentage of GDP), here.
Regardless of whether the number is 3% of 4.5%, it is not alarming at all.
Why is this alarming to you? It is fine to cherry-pick numbers that make the UPA look bad, but you should be able to explain why the number should cause alarm.rawemotions wrote:There is another figure that is more alarming. In external debt, the ratio of short term to total debt has jumped 8-fold
from 3.9 in 2004 to 24.8 in 2013.
Before I looked into national debt and exposed your confusion between national debt and external debt, you were repeatedly claiming that the external debt trend was alarming because it increased by four times. You repeated that so many times as it if was undoubtedly true. But your own data source, the RBI press release, has a table that shows the following data for external debt as a percentage of GDP:
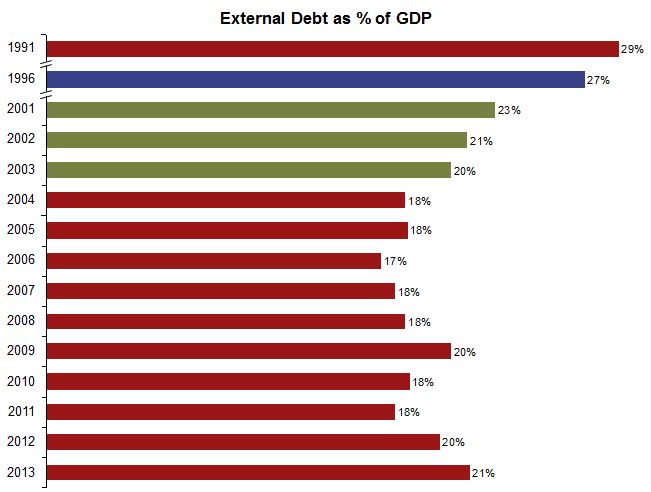
External debt as percentage of GDP was higher under NDA in 2001 than it is now! Were you more alarmed then about the future of the Indian economy than you are now?
Source: Reserve Bank of India, Press release dated June 27, 2013. Table 5, India's Key External Debt Indicators.
Idéfix- Posts : 8808
Join date : 2012-04-26
Location : Berkeley, CA
Re: Economic inequality in India: a comparative analysis
![]() by Idéfix Mon Aug 05, 2013 12:01 am
by Idéfix Mon Aug 05, 2013 12:01 am
Here is a chart using data from Table 5.

As you can see, India's debt position has been stronger for the last few years than it was under NDA. This is from the data source that you cited.
My conclusions from this are:
1. You have a dangerously half-baked understanding of the concepts, and use that half-baked understanding to cherry-pick numbers to make UPA look bad.
2. You do not read your sources well, and you ignore anything that might stop the alarm bells ringing in your head.
3. You are essentially trying to distract from the comparative analysis of UPA and NDA performance with whatever scraps of potentially alarming numbers you can find.
Idéfix- Posts : 8808
Join date : 2012-04-26
Location : Berkeley, CA
Re: Economic inequality in India: a comparative analysis
![]() by rawemotions Mon Aug 05, 2013 1:10 am
by rawemotions Mon Aug 05, 2013 1:10 am
a) anemic Job Growth (which you pointed refuse to discuss) coupled with b) rising external debt (you can conveniently exclude it), but the fact is that external DEBT has gone up four times in absolute terms, even though in GDP terms it is more of less have been the same.,
c) plus degradation in buying power of middle classes.
On external debt
~~~~~~~~~~
Please first fix your charts to reflect the correct external Sovereign Debt.
Debt service ratio is all well, if we have a positive CAD. We do not have a positive CAD or positive trade balance, so where do you have the money to pay? If we do not have money to pay it is just a statistic. You need to borrow money just to service debt and also finance imports.
If UPA is doing great on external debt front, why has Chidu floated the ide of mopping foreign exchange using Sovereign bonds? Many be Chidu knows the real story?
Infact I am not the only one saying it, Blackrock institute RIsk profile is saying. It has given India a rank next to Spain in Sovereign Risk. That should be comforting for us, being next to a country that was in danger of default long ago. How do you explain this ?
http://www.blackrock.com/corporate/en-us/news-and-insights/blackrock-investment-institute-risk-index#
Moreover GS has already said it, as pointed above.
rawemotions- Posts : 1690
Join date : 2011-05-03
Re: Economic inequality in India: a comparative analysis
![]() by rawemotions Mon Aug 05, 2013 1:26 am
by rawemotions Mon Aug 05, 2013 1:26 am
Idéfix wrote:I have already provided the source for my chart. From a previous post:rawemotions wrote:Something is NOT right in your charts. If you actually referred to Sovereign External Debt, the table in the iRBI link gives the following Sovereign debt to GDP percentages from 2007 till 2013. Whereas your chart gives 3% for 2011 instead of 4.5%. It looks you are NOT including some component in sovereign External debt. So even in Sovereign External Debt, you need to fix your charts.
Source: Reserve Bank of India, Handbook of Statistics on the Indian Economy, Table 237: Select Debt Indicators of the Central and State Governments (as percentage of GDP), here.
Regardless of whether the number is 3% of 4.5%, it is not alarming at all.Why is this alarming to you? It is fine to cherry-pick numbers that make the UPA look bad, but you should be able to explain why the number should cause alarm.rawemotions wrote:There is another figure that is more alarming. In external debt, the ratio of short term to total debt has jumped 8-fold
from 3.9 in 2004 to 24.8 in 2013.
Before I looked into national debt and exposed your confusion between national debt and external debt, you were repeatedly claiming that the external debt trend was alarming because it increased by four times. You repeated that so many times as it if was undoubtedly true. But your own data source, the RBI press release, has a table that shows the following data for external debt as a percentage of GDP:
External debt as percentage of GDP was higher under NDA in 2001 than it is now! Were you more alarmed then about the future of the Indian economy than you are now?
Source: Reserve Bank of India, Press release dated June 27, 2013. Table 5, India's Key External Debt Indicators.
I have already provided the source for my chart. From a previous post:rawemotions wrote:Something is NOT right in your charts. If you actually referred to Sovereign External Debt, the table in the iRBI link gives the following Sovereign debt to GDP percentages from 2007 till 2013. Whereas your chart gives 3% for 2011 instead of 4.5%. It looks you are NOT including some component in sovereign External debt. So even in Sovereign External Debt, you need to fix your charts.
Source: Reserve Bank of India, Handbook of Statistics on the Indian Economy, Table 237: Select Debt Indicators of the Central and State Governments (as percentage of GDP), here.
Regardless of whether the number is 3% of 4.5%, it is not alarming at all.
A 1.5% error in percentage of GDP is not a small amount. It paints a wrong picture as if, they are really improved on External Sovereign debt, whereas this is NOT the case.
Why is this alarming to you? It is fine to cherry-pick numbers that make the UPA look bad, but you should be able to explain why the number should cause alarm.rawemotions wrote:There is another figure that is more alarming. In external debt, the ratio of short term to total debt has jumped 8-fold
from 3.9 in 2004 to 24.8 in 2013.
I had been saying from my first post is that short term external debt is alarming. It was nothing and now grown to 100Bn Dollars. It was reported that, one of the reasons , India was relatively insulated from East Asian crisis and 2008 financial crisis was because it did not have high short term debt.
It is alarming because with negative CAD India does not have money to pay sudden withdrawals, without dangerously reducing foreign exchange reserves. We are in a situation where Bulk of the earned foreign exchange only goes to finance oil imports, leaving a much lesser quantity for capital goods imports, needed for a robust economy, and other needs.
In addition, worsening Exchange rate has made the repayment and interest even more difficult.
Worse, most of them are due to expire in 2014. No wonder Rupee is going south. Well as I said, you might put up a brave face, but Chidu knows the real blunders UPA has made is now proposing to float sovereign bonds. Why is that ?
Before I looked into national debt and exposed your confusion between national debt and external debt, you were repeatedly claiming that the external debt trend was alarming because it increased by four times. You repeated that so many times as it if was undoubtedly true. But your own data source, the RBI press release, has a table that shows the following data for external debt as a percentage of GDP:
External debt as percentage of GDP was higher under NDA in 2001 than it is now! Were you more alarmed then about the future of the Indian economy than you are now?
NDA left in 2004, NOT 2001. What kind of Sham logic is this? You have gone nuts, and do not even pretend to be neutral now,
In 2004, it was 18%, now it is 21%, after they UPA 9 years. Whereas NDA took it down from 23% down (in 1999 probably it was even more) to 18% in just 5 years, despite sanctions for a portion of their term.
Whereas UPA despite 9 years, have managed to increase it by 2%.
Source: Reserve Bank of India, Press release dated June 27, 2013. Table 5, India's Key External Debt Indicators.
Morever, the statistic I have from my same RBI source is that, it is NOT 21, but 24.7% a percentage of GDP. Again there is a need to reconcile th RBI source and my RBI Source. May be your charts exclude some components. But that will only change absolute numbers and are unlikely to influence the trend, which clearly shows UPA has failed in overall external debt. Moreover the 23-24% debt NDA inherited is because of faulty economic policies of Congress from the bulk of years from Independence till 1990's. Now it is clear they are set to again introduce again the same mindless socialism cherry picking communities to help, and screw it again.
rawemotions- Posts : 1690
Join date : 2011-05-03
Re: Economic inequality in India: a comparative analysis
![]() by rawemotions Mon Aug 05, 2013 1:32 am
by rawemotions Mon Aug 05, 2013 1:32 am
Idéfix wrote:This is wrong. The numbers do account for inflation. These charts indicate the percentage of population that was at a certain level of monthly consumption, that level being compared after accounting for inflation.rawemotions wrote:Your charts only consider Inflation as one number, but does not account for this in anyway.
You did not get it, I meant middle classes predominantly consume essential commodities. Bulk of the essential commodities bought by poor and middle classes are groceries, pulses and cereals, edible oils. The prices of most of these have gone up 300%. The inflation does not reflect this number because it includes a basket of commodities and does not say 300%, but may be 10-12%. Thus there is no way to determine how much the buying power has eroded for a family who predominantly consume food,groceries, pulses/cereals at a higher proportion of their overall consumption, compared to a family which exactly consumes the basket of commodities considered for inflation. Moreover inflation only considers wholesale prices and does NOT consider retail prices as far as I know. Retail prices include the additional effect of transportation price increases on end costs.
I really do not know how the charts account for that.
rawemotions- Posts : 1690
Join date : 2011-05-03
Re: Economic inequality in India: a comparative analysis
![]() by Idéfix Mon Aug 05, 2013 2:08 am
by Idéfix Mon Aug 05, 2013 2:08 am
You are wrong on both counts. The baskets used for CPI are skewed towards the consumption patterns of the lower middle class. And consumer price index tracks retail prices, not wholesale prices. In fact, there are four tailored baskets for consumer price index: agricultural laborers, industrial workers, industrial workers excluding food items, and urban non-manual employees. As you can read from the names, they are designed to track the price impacts felt by the lower middle class occupations, not the rich.rawemotions wrote:Idéfix wrote:This is wrong. The numbers do account for inflation. These charts indicate the percentage of population that was at a certain level of monthly consumption, that level being compared after accounting for inflation.rawemotions wrote:Your charts only consider Inflation as one number, but does not account for this in anyway.
You did not get it, I meant middle classes predominantly consume essential commodities. Bulk of the essential commodities bought by poor and middle classes are groceries, pulses and cereals, edible oils. The prices of most of these have gone up 300%. The inflation does not reflect this number because it includes a basket of commodities and does not say 300%, but may be 10-12%. Thus there is no way to determine how much the buying power has eroded for a family who predominantly consume food,groceries, pulses/cereals at a higher proportion of their overall consumption, compared to a family which exactly consumes the basket of commodities considered for inflation. Moreover inflation only considers wholesale prices and does NOT consider retail prices as far as I know. Retail prices include the additional effect of transportation price increases on end costs.
I really do not know how the charts account for that.
Idéfix- Posts : 8808
Join date : 2012-04-26
Location : Berkeley, CA
Re: Economic inequality in India: a comparative analysis
![]() by rawemotions Mon Aug 05, 2013 2:15 am
by rawemotions Mon Aug 05, 2013 2:15 am
I need to go through that list to see how they are constructed.Idéfix wrote:You are wrong on both counts. The baskets used for CPI are skewed towards the consumption patterns of the lower middle class. And consumer price index tracks retail prices, not wholesale prices. In fact, there are four tailored baskets for consumer price index: agricultural laborers, industrial workers, industrial workers excluding food items, and urban non-manual employees. As you can read from the names, they are designed to track the price impacts felt by the lower middle class occupations, not the rich.rawemotions wrote:Idéfix wrote:This is wrong. The numbers do account for inflation. These charts indicate the percentage of population that was at a certain level of monthly consumption, that level being compared after accounting for inflation.rawemotions wrote:Your charts only consider Inflation as one number, but does not account for this in anyway.
You did not get it, I meant middle classes predominantly consume essential commodities. Bulk of the essential commodities bought by poor and middle classes are groceries, pulses and cereals, edible oils. The prices of most of these have gone up 300%. The inflation does not reflect this number because it includes a basket of commodities and does not say 300%, but may be 10-12%. Thus there is no way to determine how much the buying power has eroded for a family who predominantly consume food,groceries, pulses/cereals at a higher proportion of their overall consumption, compared to a family which exactly consumes the basket of commodities considered for inflation. Moreover inflation only considers wholesale prices and does NOT consider retail prices as far as I know. Retail prices include the additional effect of transportation price increases on end costs.
I really do not know how the charts account for that.
Is there a list that explains these ? So what is the inflation for each of these class.
What about weightage of products in each basket ? In addition what about the fact Inflation does NOT account for retail prices, and thus excludes the inflation in transportation costs to retail markets and other margins retailers add (cost of real estate, increase in labour etc..)
Consumers have felt 300% inflation (over the past 9 years) on the prices of groceries and essentials. Does inflation reflect these numbers ?
rawemotions- Posts : 1690
Join date : 2011-05-03
Re: Economic inequality in India: a comparative analysis
![]() by Idéfix Mon Aug 05, 2013 2:22 am
by Idéfix Mon Aug 05, 2013 2:22 am
Yes, preferably some time in the near future. It would be fantastic if you took a look before you make more comments about what is accounted for or not. It is truly remarkable how you feel qualified to make strong statements about stuff that you have at best a half-baked understanding of!rawemotions wrote:I need to go through that list to see how they are constructed.
Where did you get this from? Consumer Price Index is based on for prices paid by consumers, which are at retail locations. There is a separate index called Wholesale Price Index, which does NOT account for retail prices by design.rawemotions wrote:In addition what about the fact Inflation does NOT account for retail prices, and thus excludes the inflation in transportation costs to retail markets and other margins retailers add (cost of real estate, increase in labour etc..)
I don't know where that 300% number is coming from. I don't put a lot of trust in anecdotal or perception-based numbers. Inflation baskets for CPI are set up using the five-year National Sample Survey, the largest such exercise in India, which captures in excruciating detail consumption patterns across India.rawemotions wrote:Consumers have felt 300% inflation on the prices of groceries and essentials. Does inflation reflect these numbers ?
Idéfix- Posts : 8808
Join date : 2012-04-26
Location : Berkeley, CA
Re: Economic inequality in India: a comparative analysis
![]() by Idéfix Mon Aug 05, 2013 2:39 am
by Idéfix Mon Aug 05, 2013 2:39 am
Whether you have a positive or a negative trade balance, debt service ratio actually indicates your ability to service your foreign debts. If the ratio had risen under UPA, you would have touted that as a major problem and cause for alarm.rawemotions wrote:Debt service ratio is all well, if we have a positive CAD. We do not have a positive CAD or positive trade balance, so where do you have the money to pay? If we do not have money to pay it is just a statistic. You need to borrow money just to service debt and also finance imports.
Idéfix- Posts : 8808
Join date : 2012-04-26
Location : Berkeley, CA
Re: Economic inequality in India: a comparative analysis
![]() by Idéfix Mon Aug 05, 2013 2:52 am
by Idéfix Mon Aug 05, 2013 2:52 am
RBI's handbook clearly shows an improved picture on external liabilities of the central government. I have given you a source so you can verify it for yourself.rawemotions wrote:A 1.5% error in percentage of GDP is not a small amount. It paints a wrong picture as if, they are really improved on External Sovereign debt, whereas this is NOT the case.
But as I said, I don't think 4.5% is alarming. I don't think 7% was alarming when the NDA carried that level of external sovereign debt before it left office.
You claim that external debt at 21% of GDP is cause for alarm. My question is, is that level of external debt cause for alarm only when the wrong party is in power according to you? Or were you equally worried when NDA was in power with external debt at 22% of GDP?rawemotions wrote:I had been saying from my first post is that short term external debt is alarming.NDA left in 2004, NOT 2001. What kind of Sham logic is this? You have gone nuts, and do not even pretend to be neutral now,Idefix wrote:External debt as percentage of GDP was higher under NDA in 2001 than it is now! Were you more alarmed then about the future of the Indian economy than you are now?
In 2004, it was 18%, now it is 21%, after they UPA 9 years. Whereas NDA took it down from 23% down (in 1999 probably it was even more) to 18% in just 5 years, despite sanctions for a portion of their term.
Whereas UPA despite 9 years, have managed to increase it by 2%.
My charts are based on the source I have already provided. I have not excluded any components. The press release you cited may have provisional numbers. The numbers I charted are from their official Handbook of Statistics on the Indian Economy.rawemotions wrote:Morever, the statistic I have from my same RBI source is that, it is NOT 21, but 24.7% a percentage of GDP. Again there is a need to reconcile th RBI source and my RBI Source. May be your charts exclude some components.
Let me ask you this. What is the optimum level of external debt to GDP in your mind?rawemotions wrote:But that will only change absolute numbers and are unlikely to influence the trend, which clearly shows UPA has failed in overall external debt. Moreover the 23-24% debt NDA inherited is because of faulty economic policies of Congress from the bulk of years from Independence till 1990's. Now it is clear they are set to again introduce again the same mindless socialism cherry picking communities to help, and screw it again.
I think it is nothing less than stupid to credit or blame a government for a metric in which it has only 20% control. India's external debt is 20% public, 80% private. Unless you are arguing for tight government control on capital markets -- and I hope you are not, given your pro-BJP views -- this is not a ratio that the government can manage to. This is similar to trying to judge a government by the change in trade deficit -- a pointless distraction!
Idéfix- Posts : 8808
Join date : 2012-04-26
Location : Berkeley, CA
Re: Economic inequality in India: a comparative analysis
![]() by Merlot Daruwala Mon Aug 05, 2013 3:04 am
by Merlot Daruwala Mon Aug 05, 2013 3:04 am
Future combatants are advised to enter the ring only after sufficient preparation in terms of understanding of economic fundamentals and only if they can back up their statements with verifiable data. So please leave your raw emotions at home.

Merlot Daruwala- Posts : 5005
Join date : 2011-04-29
Re: Economic inequality in India: a comparative analysis
![]() by Petrichor Mon Aug 05, 2013 4:05 pm
by Petrichor Mon Aug 05, 2013 4:05 pm
Petrichor- Posts : 1725
Join date : 2012-04-10
Re: Economic inequality in India: a comparative analysis
![]() by rawemotions Tue Aug 06, 2013 2:12 am
by rawemotions Tue Aug 06, 2013 2:12 am
Merlot Daruwala wrote:After a detailed perusal of the thread and closely following the last few exchanges, I hereby intervene to stop the bout on humanitarian grounds. This round goes to Idefix.
Future combatants are advised to enter the ring only after sufficient preparation in terms of understanding of economic fundamentals and only if they can back up their statements with verifiable data. So please leave your raw emotions at home.
May be you need to re-define what it means to carefully peruse the thread. I have cited sources for my data on external debt. You can verify them yourself. The current external debt is 390 Bn dollars. It is highly subjective to claim, that it is acceptable. That is the what the Idefix is claming just purely on ratio of Debt to GDP Grounds. But the economists of hte world Goldman Sachs OR Blackrock Sovereign Risk Institute do not think so.
Buddy if your masters (UPA) hadn't screwed up the Economy so bad, Rs wouldn't be at 61.50 today.
The fact is that it has gone up by four times compared to 2004. There is nothing fictitious about this.
rawemotions- Posts : 1690
Join date : 2011-05-03
Re: Economic inequality in India: a comparative analysis
![]() by rawemotions Tue Aug 06, 2013 3:01 am
by rawemotions Tue Aug 06, 2013 3:01 am
a) If the economy is doing great, please explain to me, why INR is at 61.50 today?Idéfix wrote:RBI's handbook clearly shows an improved picture on external liabilities of the central government. I have given you a source so you can verify it for yourself.rawemotions wrote:A 1.5% error in percentage of GDP is not a small amount. It paints a wrong picture as if, they are really improved on External Sovereign debt, whereas this is NOT the case.
But as I said, I don't think 4.5% is alarming. I don't think 7% was alarming when the NDA carried that level of external sovereign debt before it left office.You claim that external debt at 21% of GDP is cause for alarm. My question is, is that level of external debt cause for alarm only when the wrong party is in power according to you? Or were you equally worried when NDA was in power with external debt at 22% of GDP?rawemotions wrote:I had been saying from my first post is that short term external debt is alarming.NDA left in 2004, NOT 2001. What kind of Sham logic is this? You have gone nuts, and do not even pretend to be neutral now,Idefix wrote:External debt as percentage of GDP was higher under NDA in 2001 than it is now! Were you more alarmed then about the future of the Indian economy than you are now?
In 2004, it was 18%, now it is 21%, after they UPA 9 years. Whereas NDA took it down from 23% down (in 1999 probably it was even more) to 18% in just 5 years, despite sanctions for a portion of their term.
Whereas UPA despite 9 years, have managed to increase it by 2%.My charts are based on the source I have already provided. I have not excluded any components. The press release you cited may have provisional numbers. The numbers I charted are from their official Handbook of Statistics on the Indian Economy.rawemotions wrote:Morever, the statistic I have from my same RBI source is that, it is NOT 21, but 24.7% a percentage of GDP. Again there is a need to reconcile th RBI source and my RBI Source. May be your charts exclude some components.Let me ask you this. What is the optimum level of external debt to GDP in your mind?rawemotions wrote:But that will only change absolute numbers and are unlikely to influence the trend, which clearly shows UPA has failed in overall external debt. Moreover the 23-24% debt NDA inherited is because of faulty economic policies of Congress from the bulk of years from Independence till 1990's. Now it is clear they are set to again introduce again the same mindless socialism cherry picking communities to help, and screw it again.
I think it is nothing less than stupid to credit or blame a government for a metric in which it has only 20% control. India's external debt is 20% public, 80% private. Unless you are arguing for tight government control on capital markets -- and I hope you are not, given your pro-BJP views -- this is not a ratio that the government can manage to. This is similar to trying to judge a government by the change in trade deficit -- a pointless distraction!
b) If external Debt is picture perfect, then why is Chidu floating the idea of Sovereign Bonds ? May be, he knows the real truth of massive increase in Short Term External Debt to almost 100 Bn dollars expiring in 2014.
c) Explain Why Blackrock Sovereign Risk Institute has ranked India as 39 Next to Spain in terms of Sovereign Risk ?
d) Explain Why Goldman Sachs has degraded India's rating?
This kind of screw up despite 9 years of UPA rule.
These are gross discrepancies, compared to the picture you paint of a great improving, sustaining economy,
Growth can be obtained , but what matters is the cost incurred to achieve growth and whether the growth is sustainable. UPA has been too short term focused that it has made many tragic mistakes in long term management of the economy, where Social Schemes have been dished out, without any regard to the effect on fiscal deficit. A one time Loan waiver is one thing, but committing to spend Rs 123000 crores every year on Food security covering 60% of the population is unheard off. They went overboard on that, just to win elections. If the same UPA had made the scheme conditional on achieving Fiscal Deficit, then I would appreciate it. In India, once you introduce a freebie it is very difficult to curtail it.
To me it looks like UPA is experimenting with the economy and all they have been doing is applying many band-aids to fix the problems, created by their poorly planned and unregulated social schemes.
Just constructing a few charts does not make you an economist. I am not one either, but ask any one in India and the chances are that they have been affected by the rapid price rise of essential commodities. You want an example of 300% inflation, please go and research the prices of Fruits and Vegetables in 2004 and the prices today, you will easily that it is 300%. This is the truth which you cannot deny.
Worsening Rupee (unheard of 61.50 to a dollar), Anemic Job Growth, Worsening Deficit and external Short term debt, Monetary policy that does not support Industrialists, and on the top of it massive corruption, with ill conceived and poorly executed Social Schemes. Yes they have maintained GDP growth, but they have also made mistakes in other aspects. That is what UPA gave to the country.
In my opinion, the only lasting, positive thing they have contributed was Aadhaar, and Cash Transfer. But an electronic entitlement state needs a strong regulator to prevent the government from removing or adding benefits at the touch of the button without considering future cost and debt. Here also by their narrow minded approach of just winning elections, they cannot think of long term issues.
So your data (subject to the corrections you need to make on external debt charts) are fine, the results from individual chart is all ok, but I vehemently disagree with your conclusions when you put them all together based on just a few parameters, conveniently leaving out many others.
The fact is that many people around the world do not think so.
rawemotions- Posts : 1690
Join date : 2011-05-03
Re: Economic inequality in India: a comparative analysis
![]() by Merlot Daruwala Tue Aug 06, 2013 3:23 am
by Merlot Daruwala Tue Aug 06, 2013 3:23 am
rawemotions wrote:Buddy if your masters (UPA) hadn't screwed up the Economy so bad, Rs wouldn't be at 61.50 today.
The fact is that it has gone up by four times compared to 2004. There is nothing fictitious about this.
Rawmotions, I guess you are a glutton for punishment. Accepting for a second, your basic premise that the Rupee depreciation is a very very bad thing, here is the data on how much each regime "screwed up the Economy":
Average USD-INR from 1991-1996: Rs 31.1316
Average USD-INR from 1998-2004: Rs 45.5183
Average USD-INR from 2004-till date: Rs 47.296
Rupee depreciation during NDA regime vis-a-vis the previous regime: 46.2%
Rupee depreciation during UPA-I & II vis-a-vis the previous regime: 3.9%
Ball's in your court, O insightful economist.
Source: http://rbidocs.rbi.org.in/rdocs/Publications/PDFs/0HBSF15092011.pdf
Merlot Daruwala- Posts : 5005
Join date : 2011-04-29
Re: Economic inequality in India: a comparative analysis
![]() by rawemotions Tue Aug 06, 2013 3:28 am
by rawemotions Tue Aug 06, 2013 3:28 am
I never said in this thread, that NDA did a great job with the economy. I just disagree with your conclusion that UPA has improved it, as claimed by you, which you based on just one or two parameters.Idéfix wrote:RBI's handbook clearly shows an improved picture on external liabilities of the central government. I have given you a source so you can verify it for yourself.rawemotions wrote:A 1.5% error in percentage of GDP is not a small amount. It paints a wrong picture as if, they are really improved on External Sovereign debt, whereas this is NOT the case.
But as I said, I don't think 4.5% is alarming. I don't think 7% was alarming when the NDA carried that level of external sovereign debt before it left office.You claim that external debt at 21% of GDP is cause for alarm. My question is, is that level of external debt cause for alarm only when the wrong party is in power according to you? Or were you equally worried when NDA was in power with external debt at 22% of GDP?rawemotions wrote:I had been saying from my first post is that short term external debt is alarming.NDA left in 2004, NOT 2001. What kind of Sham logic is this? You have gone nuts, and do not even pretend to be neutral now,Idefix wrote:External debt as percentage of GDP was higher under NDA in 2001 than it is now! Were you more alarmed then about the future of the Indian economy than you are now?
In 2004, it was 18%, now it is 21%, after they UPA 9 years. Whereas NDA took it down from 23% down (in 1999 probably it was even more) to 18% in just 5 years, despite sanctions for a portion of their term.
Whereas UPA despite 9 years, have managed to increase it by 2%.
Even on poverty alleviation numbers, a number you talked about indirectly, by talking of inequality etc.. the planning commission itself and UPA functionaries, are saying now that it needs to be revised.
In my opinion while GDP growth might have been maintained OR even marginally improved, and Social Schemes implemented, the UPA has NOT done a good job on employment generation, Price Rise, Monetary Policies (that supports industry), Power and Road Infrastructure, Current Account/Fiscal Deficit, external debt, Stopping Black Money proliferation, Preventing Corruption and boosting Non-conventional energy sources.
I feel this is a fairly accurate picture today of the state of affairs.
For India, if you consider total debt (external + state + central debt), it is almost 100% of GDP and that is higher compared to other BRIC countries (excluding China since their data is suspect). Blackrock is saying it, and so are many other economists. In addition, India has a unique problem that it has to import almost 70% of its oil and it has proven to be a big drag on the economy. Congress has contributed to this problem of debt in a big way since they ruled the country for most for the past 60 years.
If you want prognosis on Indian economy, may be it is better to ask DesiChatter. He has been accurate in his predictions.
My gut feeling is that INR will touch 65 in the next year or so, unless GOI takes some decisive steps to reign in the Rupee. After the short term debt repayment issue recedes in 2014, it might revert back to 55.
rawemotions- Posts : 1690
Join date : 2011-05-03
Re: Economic inequality in India: a comparative analysis
![]() by Idéfix Tue Aug 06, 2013 8:35 pm
by Idéfix Tue Aug 06, 2013 8:35 pm
Wrong. I used internal and external comparisons of GDP growth (UPA vs. NDA, India vs. China, Brazil, Indonesia, etc..), gap in growth with China under different governments, growth in per-capita GDP, HDI improvement, and economic inequality. I have analyzed GDP numbers every sensible way suggested by people, with three-year moving averages, adjusting for consumer price inflation vs. GDP deflator, etc. Thanks to you, I even looked at debt, and confirmed my hunch that it wasn't as alarming as you were painting it by getting your concepts wrong.rawemotions wrote:I never said in this thread, that NDA did a great job with the economy. I just disagree with your conclusion that UPA has improved it, as claimed by you, which you based on just one or two parameters.
Wrong again! If you read my posts on this thread, you should know that I did not use the government's poverty alleviation numbers. Instead, I went to the source data from NSS. The ongoing debate about the definition of poverty levels does not affect my analysis, because I did not want to use those subjective levels anyway.rawemotions wrote:Even on poverty alleviation numbers, a number you talked about indirectly, by talking of inequality etc.. the planning commission itself and UPA functionaries, are saying now that it needs to be revised.
Idéfix- Posts : 8808
Join date : 2012-04-26
Location : Berkeley, CA
Re: Economic inequality in India: a comparative analysis
![]() by Idéfix Tue Aug 06, 2013 8:57 pm
by Idéfix Tue Aug 06, 2013 8:57 pm
Ok, let us assume something worse* than your gut feel: that USD will touch Rs. 65 this year, and revert to Rs. 55 later. Let us say that the average price of a USD for the fiscal year 2013-'14 is Rs. 60. We opened the year at Rs. 54 in April, and the USD has touched Rs. 61 in August. So if your prediction turns out to be true of Rs. 65 for a few months and then a return to Rs. 55, a fiscal-year average of Rs. 60 would be reasonable.rawemotions wrote:My gut feeling is that INR will touch 65 in the next year or so, unless GOI takes some decisive steps to reign in the Rupee. After the short term debt repayment issue recedes in 2014, it might revert back to 55.
Now, let us go to the source I have been using for a while now: RBI's Handbook of Statistics on Indian Economy. In Table 146: Exchange Rates, column 3 for USD-INR. The chart below shows average exchange rate each fiscal year. The numbers for 2012 and 2013 are not from RBI, but they are my estimates. I put in Rs. 60 as the average for 2013, as mentioned above.

Now, let us turn these into CAGRs. Because you argue that the rupee losing value is a bad thing, high CAGR = bad*. The chart below shows the CAGR under each government. For UPA, the CAGR is based on the Rs. 60 average for 2013.

See that? Even if the USD goes to Rs. 65 this year, not next, and averages at Rs. 60 for the year, UPA will still perform better on protecting the value of the rupee than NDA did. In fact, even if the USD averages Rs. 65 this year, which means it peaking at Rs. 70 or over, UPA will still be slightly better than NDA on this metric!
Merlot already showed you the same insight with simpler numbers, but I thought you might not trust those numbers because they don't explicitly show the high end of Rs. 60. But now you know. It is high time you stopped floundering about for numbers to cherry-pick that might make UPA look bad, don't you think?
* It is not so black-and-white in reality; exporters like a depreciating rupee.
Idéfix- Posts : 8808
Join date : 2012-04-26
Location : Berkeley, CA
Re: Economic inequality in India: a comparative analysis
![]() by Marathadi-Saamiyaar Tue Aug 06, 2013 9:15 pm
by Marathadi-Saamiyaar Tue Aug 06, 2013 9:15 pm
rawemotions wrote:
For India, if you consider total debt (external + state + central debt), it is almost 100% of GDP and that is higher compared to other BRIC countries (excluding China since their data is suspect). Blackrock is saying it, and so are many other economists. In addition, India has a unique problem that it has to import almost 70% of its oil and it has proven to be a big drag on the economy. Congress has contributed to this problem of debt in a big way since they ruled the country for most for the past 60 years.
.
Very well said.. Internal debt the country print Re and sell bonds to get out of a crisis. But, external debt is a different story. With imports of around 50 Bil/ month, its reserves of some 260 Bill is good for only 5 months - Pray God the Arabs dont go trigger happy.
The short-term debt is around 30% of the total debt and 30% of reserves. That is one reason why the GoI is opening up to Wal-mart and others in the hope they will RUSH in the dollars overnight to serve as a cushion.
Here is a good outline...
Marathadi-Saamiyaar- Posts : 17675
Join date : 2011-04-30
Age : 110
Re: Economic inequality in India: a comparative analysis
![]() by Marathadi-Saamiyaar Tue Aug 06, 2013 10:25 pm
by Marathadi-Saamiyaar Tue Aug 06, 2013 10:25 pm
Marathadi-Saamiyaar wrote:rawemotions wrote:
For India, if you consider total debt (external + state + central debt), it is almost 100% of GDP and that is higher compared to other BRIC countries (excluding China since their data is suspect). Blackrock is saying it, and so are many other economists. In addition, India has a unique problem that it has to import almost 70% of its oil and it has proven to be a big drag on the economy. Congress has contributed to this problem of debt in a big way since they ruled the country for most for the past 60 years.
.
Very well said.. Internal debt the country print Re and sell bonds to get out of a crisis. But, external debt is a different story. With imports of around 50 Bil/ month, its reserves of some 260 Bill is good for only 5 months - Pray God the Arabs dont go trigger happy.
The short-term debt is around 30% of the total debt and 30% of reserves. That is one reason why the GoI is opening up to Wal-mart and others in the hope they will RUSH in the dollars overnight to serve as a cushion.
Here is a good outline...
Today in Parliament The Congress was asked if it was for India or Pakistan when AK Antony termed the killing of soldiers as "terrorists in Paki uniform" in a typical Merlotan style.
...Indian economy that only Paki Agents and sympathizers would love and praise..
Marathadi-Saamiyaar- Posts : 17675
Join date : 2011-04-30
Age : 110
Re: Economic inequality in India: a comparative analysis
![]() by rawemotions Sat Aug 17, 2013 6:22 am
by rawemotions Sat Aug 17, 2013 6:22 am
First I did not say that it will return to 55 by the fiscal year. I said in 2014. So it will alter your graphs. But still this is an interesting defence but does not help the issue I talked about earlier. More on the danger of falling rupee down below.Idéfix wrote:Ok, let us assume something worse* than your gut feel: that USD will touch Rs. 65 this year, and revert to Rs. 55 later. Let us say that the average price of a USD for the fiscal year 2013-'14 is Rs. 60. We opened the year at Rs. 54 in April, and the USD has touched Rs. 61 in August. So if your prediction turns out to be true of Rs. 65 for a few months and then a return to Rs. 55, a fiscal-year average of Rs. 60 would be reasonable.rawemotions wrote:My gut feeling is that INR will touch 65 in the next year or so, unless GOI takes some decisive steps to reign in the Rupee. After the short term debt repayment issue recedes in 2014, it might revert back to 55.
Now, let us go to the source I have been using for a while now: RBI's Handbook of Statistics on Indian Economy. In Table 146: Exchange Rates, column 3 for USD-INR. The chart below shows average exchange rate each fiscal year. The numbers for 2012 and 2013 are not from RBI, but they are my estimates. I put in Rs. 60 as the average for 2013, as mentioned above.
Now, let us turn these into CAGRs. Because you argue that the rupee losing value is a bad thing, high CAGR = bad*. The chart below shows the CAGR under each government. For UPA, the CAGR is based on the Rs. 60 average for 2013.
See that? Even if the USD goes to Rs. 65 this year, not next, and averages at Rs. 60 for the year, UPA will still perform better on protecting the value of the rupee than NDA did. In fact, even if the USD averages Rs. 65 this year, which means it peaking at Rs. 70 or over, UPA will still be slightly better than NDA on this metric!
Merlot already showed you the same insight with simpler numbers, but I thought you might not trust those numbers because they don't explicitly show the high end of Rs. 60. But now you know. It is high time you stopped floundering about for numbers to cherry-pick that might make UPA look bad, don't you think?
* It is not so black-and-white in reality; exporters like a depreciating rupee.
Anyway, looks like Chidu knows the risks, I am talking about it.
He has literally pressed the panic button. So you need to ask yourself, what does
he know that you don't know ?
As of today, he has after a long time, imposed massive Capital controls (a la 1991) and reversed the policies that allowed gradual convertibility on capital account
a) Slashed amount of Foreign Currency Indians buy using Rs
b) Restricted withdrawals.
There are numerous news reports of Sovereign Downgrade. As I indicated earlier Blackrock Sovereign Risk has ranked India next to Spain. If as you portray every thing is great,
a) Why should Chidu go for Capital controls on an allegedly good economy ?
b) Why is BSRI ranked Indiat a low 39, next to spain
c) Why are analysts threating Sovereign downgrades
The fiscal profligacy of UPA is coming to haunt them.
Rs is down to Rs 62 now.
Anyway you did not read my previous posts. The main danger of Rs exchange rate, is that to the debtors contributed to the massive increase in Short term external debt, almost to unprecedented levels. The UPA also contributed to this, because it managed to reduce Fiscal deficit by borrowing i.e using debt to fund deficits (not a good idea!) and it also opened the floodgates of External Commercial Borrowings. As I understand a bulk of those are due to expire in 2014 (around 100 Bn+). So far good. What is the issue here ?
A 11 Bn pull out from stock market caused Rs to come down to Rs62. What will a 100 Bn pull out cause ? Admittedly some of these entities will refinance, but now it will be at a higher rates. This is exactly the kind of situation which caused a problem in Hungary, when most of the Euro Denominated Loans had to be repaid.
The key problem is that for these borrowers, a exchange rate degradation directly adds to their interest burden.
If dollars were borrowed at 45-50 and now has to repaid at 55 to 60 with interest. It is going to be a big drain, leading to an effective interest rate of addition of around 20% to the base interest rate. I am sure this is giving CFO's sleep less nights, unless they hedged against currency variations . But hedging adds 3-4% percentages to the loan rates, making them expensive and thus many might not have done it. And I very much doubt that government entities/PSU's would have hedged. This is what the corporate CFO's must be dreading.
This is the main danger due to falling Rupee. Exports might go up , the rupee will find its value, but because of the drag of Oil imports and a running CAD, this wil just lessen the Deficit, but not be of any help to the folks who took Short Term Debts.
rawemotions- Posts : 1690
Join date : 2011-05-03
Re: Economic inequality in India: a comparative analysis
![]() by confuzzled dude Tue Feb 17, 2015 6:25 pm
by confuzzled dude Tue Feb 17, 2015 6:25 pm
http://www.outlookindia.com/article/The-Meaning-Of-Vikas/293427The state government in Rajasthan (also ruled by BJP) has been working hard at diluting people's hard won rights. On the one hand, a regressive ordinance debarring those with less than eight years of education from Panchayat elections was brought in. On the other, it closed 17,000 government schools.
The BJP has successfully created the false impression that India's policies are too "populist", that it has gone overboard in pursuing social goals and is fast becoming a nanny state for the poor. No one bothered to notice that, in fact, India is a "world champion of social underspending", as one commentator put it. Public spending on health and education is 4.7 per cent of GDP, lower than the least developed countries (6 per cent) and sub-Saharan Africa (7 per cent).
If anything, India is in danger of becoming a nanny state for the rich: when the budget for NREGA (employing 25 per cent of the rural population) was Rs 33,000 crore, tax revenue foregone to the gold and diamond industry was Rs 65,000 crore (employing under 1 per cent of the workforce)!
confuzzled dude- Posts : 10205
Join date : 2011-05-08
Page 2 of 2 • 1, 2
» India’s next big challenge: inequality
» India’s Eternal Inequality
» Economic Agenda for India 2020
» India's GDP growth and UPA's economic record